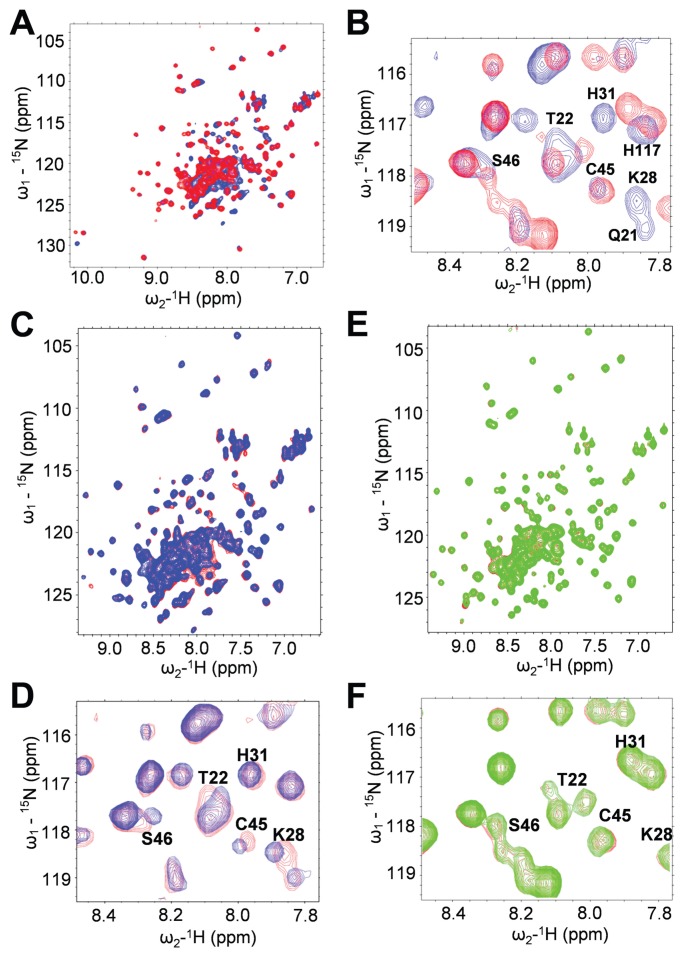
Figure 3.
Arg24 and Lys28 are required for binding SA. (A and B) Comparison of 3D structure of WT versus R24A/K28A mutant FL HMGB1 by 15N-1H HSQC 2D NMR spectroscopy. (A) R24A/K28A has a 3D structure similar to the WT HMGB1. This is demonstrated by superimposed 15N-1H HSQC spectra of WT HMGB1 (blue) and of R24A/K28A (red). Most NH sites exhibit little or no CSP due to this double mutation. (B) Amide NHs that show significant CSPs in R24A/K28A (red) compared with the WT (blue) are all localized in or near the SA-binding sites in both Box A and Box B of FL HMGB1 and include many of the NH sites that exhibit CSP due to SA binding, which are labeled in this expanded region of the superimposed spectra. (C–F) Mutant HMGB1 does not bind SA. (C) 15N-1H HSQC spectra for FL WT HMGB1 (~0.1 mmol/L) were generated in the presence (blue) or absence (red) of 15 mmol/L SA. (D) Residues that show significant CSPs due to SA binding are labeled in expanded regions of the superimposed spectra. (E) 15N-1H HSQC spectra for R24A/K28A (~0.1 mmol/L) were generated in the presence (green) or absence (red) of 15 mmol/L SA. (F) Residues that show significant CSPs due to SA binding of WT, but not of R24A/K28A, are labeled in the expanded regions of the superimposed spectra.

