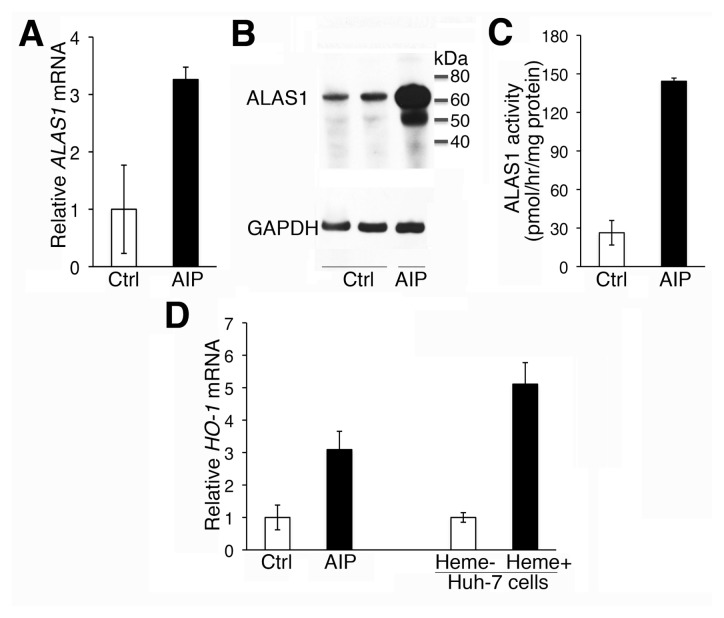
Figure 2.
Hepatic ALAS1 and HO-1 were induced in the AIP liver. Hepatic ALAS1 mRNA (A), protein expression levels (B) and enzymatic activities (C), as well as HO-1 mRNA levels (D), were determined in the AIP (n = 1) and control livers (ctrl) (n = 5). In (D), the relative HO-1 mRNA level in Huh-7 cells that were incubated for 24 h with 10 μmol/L hemin, an inducer of HO-1 expression, served as a positive control. In (A), (C) and (D), data are presented as means ± standard deviations (SDs) of three technical replicates. (B) shows a representative Western blot with two different control livers.

