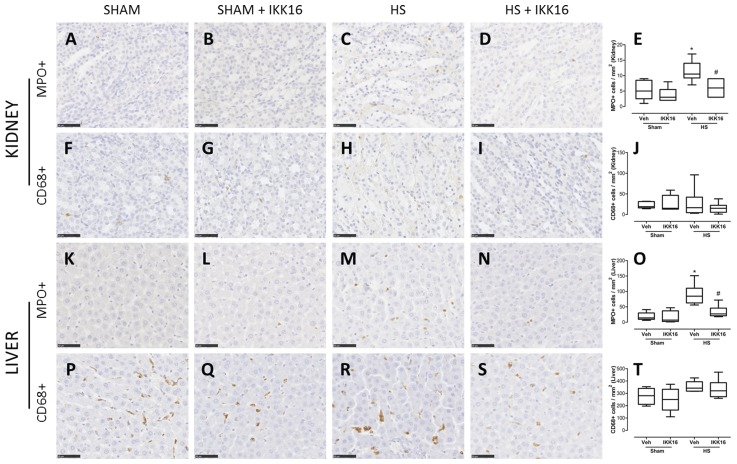
Figure 4.
IKK16 effects on inflammatory cells in kidney and liver. Rats were subjected to HS and received IKK16 (1 mg/kg; i.v.) or vehicle (Veh) (10% DMSO) at resuscitation and 4 h later kidney and liver were obtained. Sham animals were used as control. The representative images for the immunostaining for MPO as a neutrophil marker (A–D, K–N), CD68 as a macrophage marker (F–I, P–S), and the quantitative analysis of the number of cells/mm2 (E, J, O, and T) are shown. The scale bar represents 50 μm. Data are presented as box and whiskers (minimum to maximum) and the central line represents the median (n = 5–6 animals per group). *p < 0.05 versus sham group and #p < 0.05 versus HS group.

