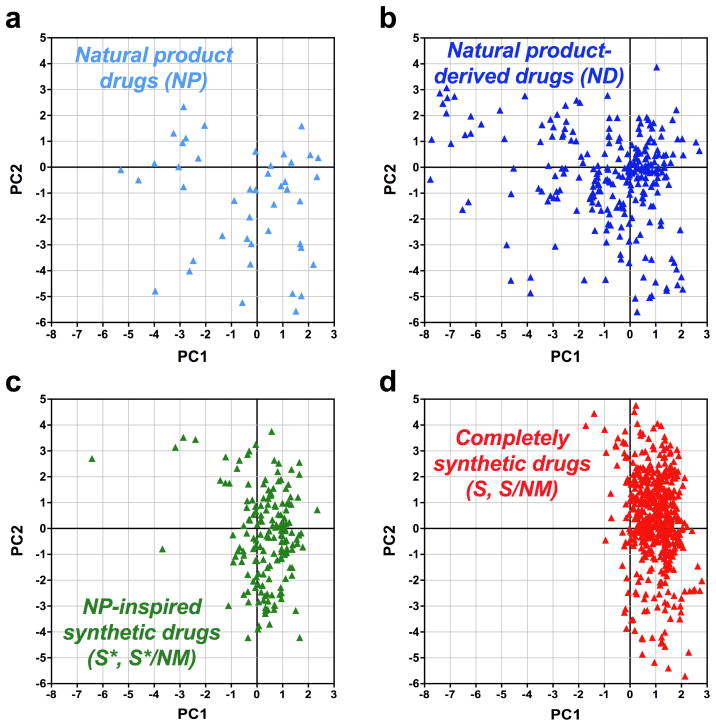
Figure 3. PCA plots of drugs approved between 1981–2010 parsed by compound class.
Data from a single analysis are shown on four separate PCA plots defined by the first two principal components, PC1 vs PC2, for (a) natural product drugs (NP), (b) natural product-derived drugs (ND), (c) natural product-inspired synthetic drugs (S*, S*/NM), and (d) completely synthetic drugs (S, S/NM).

