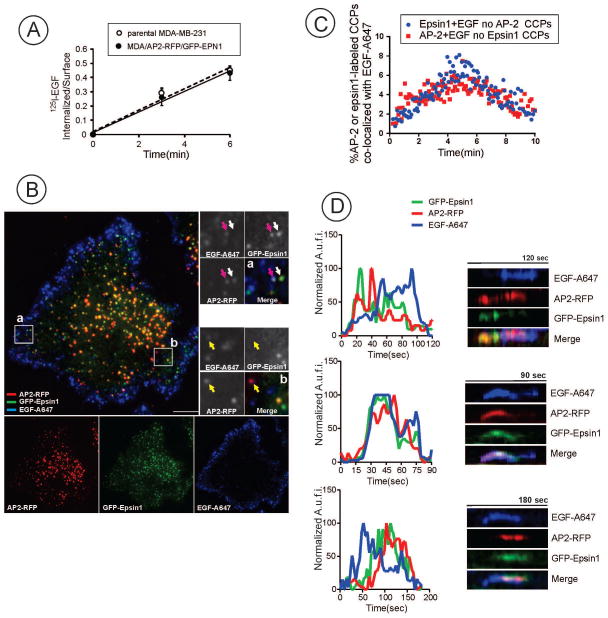
Figure 6. TIR-FM imaging of EGFR endocytosis in MDA-MB-231 cells expressing endogenously labeled epsin1 and AP2.
(A) Internalization of 125I-EGF by parental MDA-MB-231 and MDA-MB-231/AP2-RFP/GFP-EPN1 cells. The cells were incubated with 1 ng/ml 125I-EGF for the indicated times at 37°C, and the ratio of internalized and surface 125I-EGF was determined and plotted against time.
(B) Three-channel time-lapse TIR-FM imaging of cells before and after stimulation with EGF-A647 (20 ng/ml) was performed through 488 nm (GFP), 561 (RFP) and 640 (Alexa647) nm channels at 37°C. Single-channel and merged image at a 3-min time-point after EGF-A647 stimulation are shown. Insets represent high magnification merged images of the regions marked by white rectangles. Arrows show examples of co-localization of EGF-A647 with either Epsin1-GFP spots (white arrow), with both adaptor proteins (pink arrow) or AP2-RFP (yellow arrow). Scale bars, 10 μm.
(C) Percent of spots that were labeled only with either AP2-RFP or GFP-epsin1 and co-localized with EGF-Rh of the total number of spots singularly labeled with AP2-RFP or GFP-epsin1 was measured in time-series of TIR-FM imaging performed as in (A). Image analysis of 805 tracks from 5 cells was performed using Imaris 7.1 software. Mean values for each time point with error bars representing standard deviation of the mean are plotted against time.
(D) Representative examples of fluorescence traces and kymographs from time-series of AP2-RFP, GFP-epsin1 and EGF-A647 imaging in CCPs which hosted a scission event. TIR-FM imaging was performed as (B). A.u.f.i., arbitrary units of fluorescence intensity.

