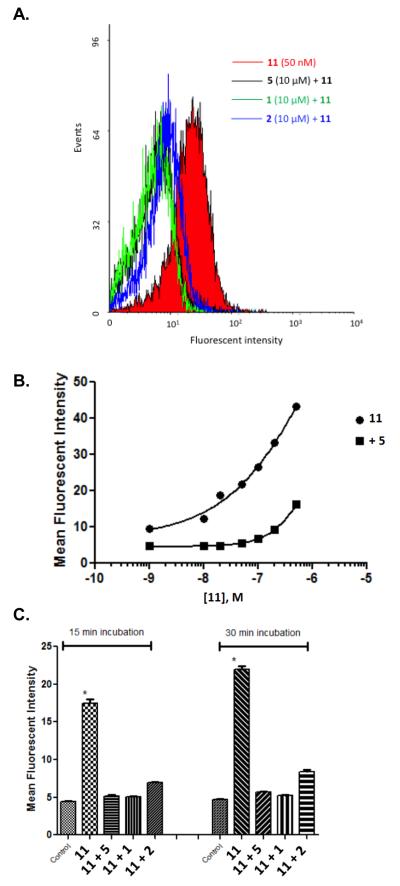
Figure 3.
(A) Inhibition of binding of 11 in P2Y14R-CHO cells by antagonist PPTN 5 and agonists UDP 1 and UDPG 2 (10 μM), analyzed by flow cytometry. Incubation of cells for 30 min with antagonist 5 or agonist 1 or 2 (all at 10 μM) followed by incubation with 11 (50 nM) for 30 min was performed. (B) Dependence of fluorescent labeling of P2Y14R-CHO cells on the concentration of 11, analyzed by flow cytometry. Incubation of cells with a variable concentration of 11 (1 nM – 500 nM) was performed following 60 min of incubation in the absence or presence of PPTN 5 (200 nM). Nearly complete inhibition of binding was observed up to 100 nM 11. (C) Fluorescence ligand binding experiments using FCM in P2Y14R-CHO cells with 11 (50 nM) after 30 min pre-incubation at 37 °C with known P2Y14R agonists 1 and 2 or P2Y14R antagonist 5 (each 10 μM). Each column shows the fluorescent intensity of each compound using 11 normalized to 100% for each time point and after correcting the mean fluorescence intensity values for auto fluorescence. Results are expressed as mean±S.E (n=3).

