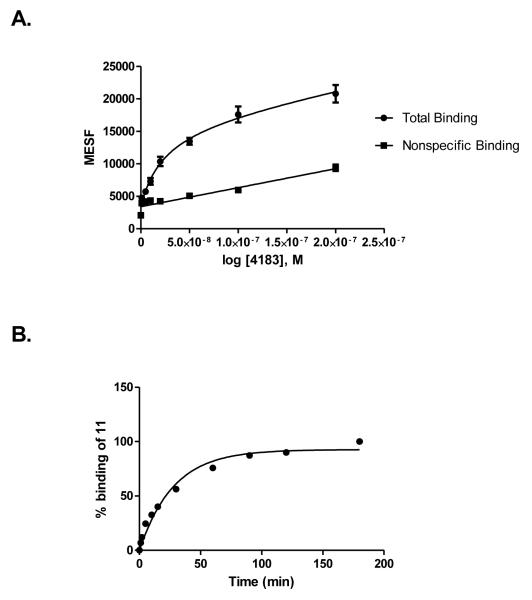
Figure 4.
(A) Saturation binding assays (B) binding kinetics with tracer 11 using FCM following incubation for 30 min with CHO cells expressing the hP2Y14R. Mean fluorescent Intensity values from FCM were converted to MESF values (Figure S6) using Quickcal program v. 2.3 (Bangs Laboratories Inc., Fishers, IN). Nonspecific binding was measured in the presence of 11 and 20 μM 5. Results are expressed as mean±S.E (n=3). In (A), the Kd value is 26.1±3.6 nM, Bmax = 44,400 MESF (n=3). In (B), 100% corresponds to a MESF value of 26,900.

