
Figure 1. Distribution of Human and Microbial Proteins.
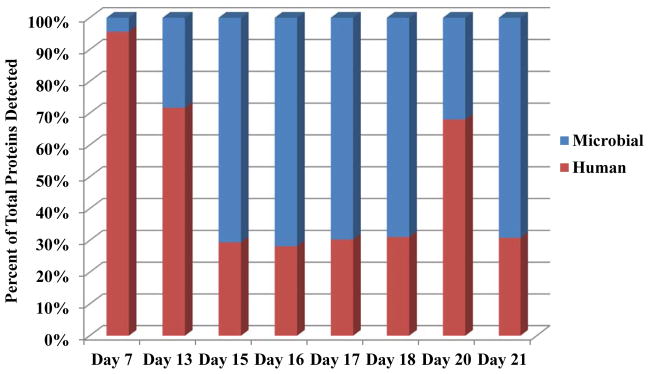
Adjusted NSAFs from microbial (blue) and human (red) protein groups were averaged between two technical replicates, summed for each time point (x-axis), and plotted as a percent of the total proteins detected for each day (y-axis). Technical variability between the two replicates was low as shown by the standard deviations of the microbial and human protein groups: day 7= 0.02%, day 13= 0.82%, day 15= 4.19%, day 16= 7.74%, day17= 7.99%, day 18= 1.71%, day 20= 0.03%, and day 21= 0.57%.