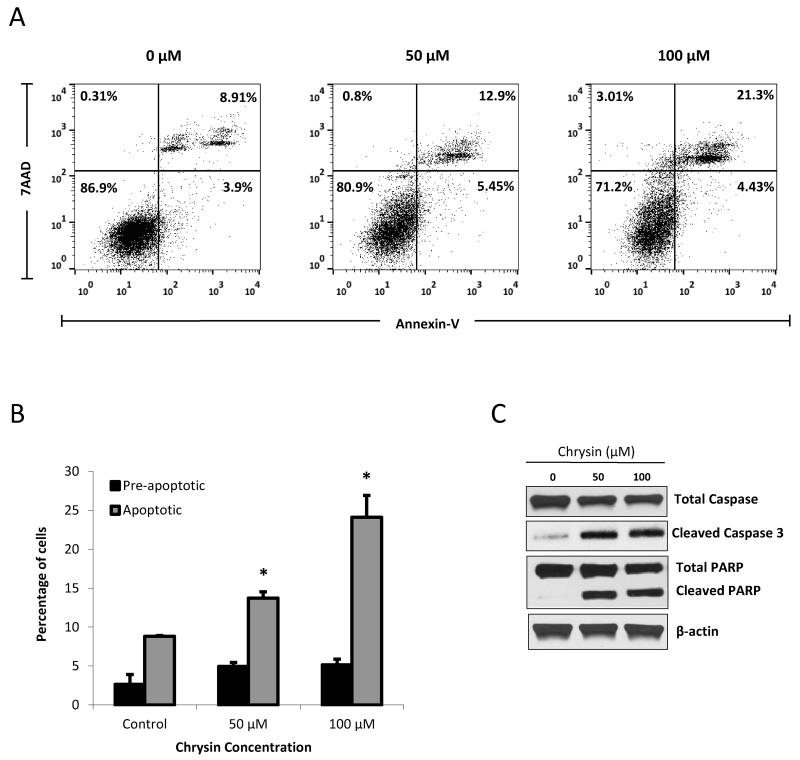
Figure 3. Chrysin treatment induces apoptosis in BON cells.
Following 2 days of chrysin treatment (0μM, 50μM and 100μM), BON cells were stained with PE Annexin V/7-AAD and quantified by phosphatidylserine exposure. Fluorescent activated cell sorting using the BD FACSCalibur™ instrumentation revealed an increase in apoptotic populations following chrysin treatment of 50μM and 100μM, shown here in one experimental replicate (A). In each pane, the lower left quadrant represents viable cells (Annexin V-negative/7-AAD-negative); the lower right quadrant represents pre-apoptotic cells; the upper right quadrant indicates late apoptotic cells (Annexin V-positive/7-AAD-positive); the upper left quadrant represents cells that were positive for 7-AAD only. Data from three independent experiments were averaged and graphed ± SEM (B) (*p<0.05). Induction of apoptosis following chrysin treatment was confirmed by cleavage of caspase-3 and the terminal apoptotic marker PARP, shown by Western blotting (C).

