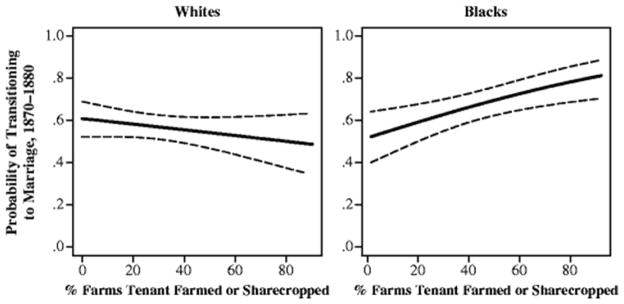
Fig. 2.

Predicted probability of transitioning to marriage, 1870–1880, among those at risk for marriage (single in 1870, age 18+ in 1880). Predictions for white and African American men are shown separately. Predicted probabilities from Table 4, Model 3, with all covariates set to their means. Solid lines represent point estimates, and dashed lines represent 95 % confidence intervals. Southern states. Linked Representative Samples, Census data
