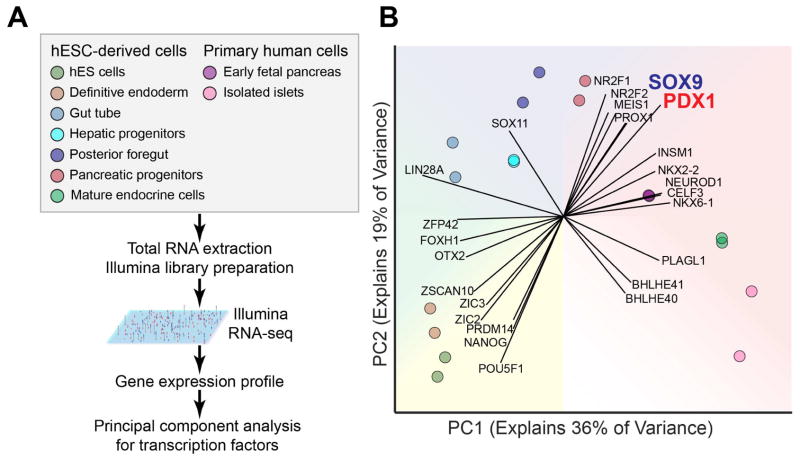
Figure 1. Principal component analysis for expression of transcription factors in endodermal cell populations.
(A) Experimental strategy for principal component analysis of transcription factors in various endodermal cell populations. (B) Principal component (PC) analysis of the expression values (RPKM) characterizing the variance explained by transcription factors expressed in human embryonic stem cell (hESC)-derived populations and primary human cells. Each vector emanating from the origin represents an individual gene. Each dot represents a sample and each color represents the type of sample.

