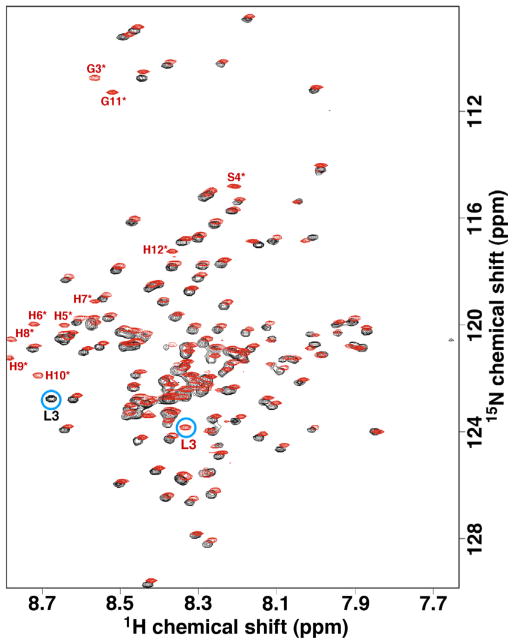
Fig. 4.
(A) Overlay of the 1H–15N HSQC spectrum of M180 (black) and hM180 (red) collected under similar experimental conditions (0.3 mM protein concentration, 2% acetic acid, pH 2.8, 20 °C) at a 1H resonance frequency of 750 MHz. The resonances for the 12-residue, N-terminal poly-histidine tag in hM180 are labeled in red and with an asterisk. Aside form the N-terminal tag, the most significant difference between the spectra of the two proteins is the resonance for L3 circled in blue. (For interpretation of the references to colour in this figure legend, the reader is referred to the web version of this article.)

