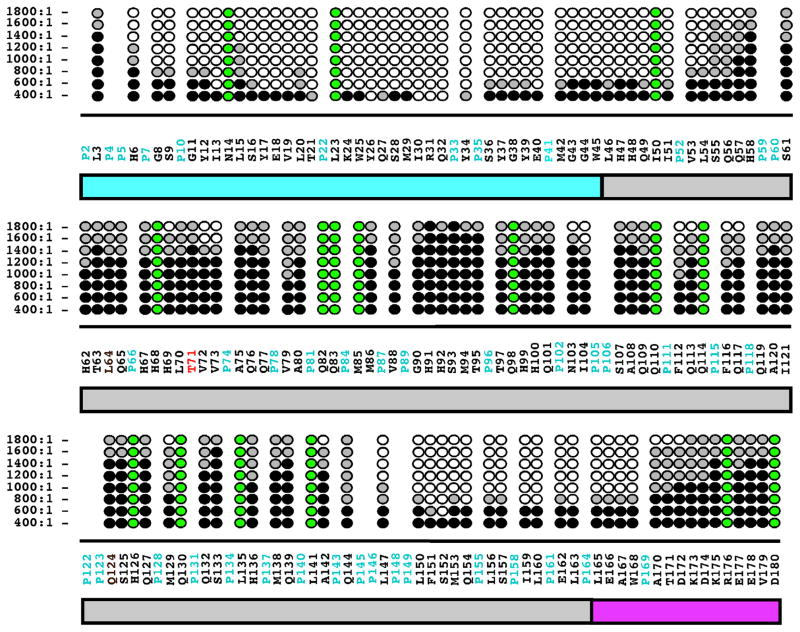
Fig. 7.
Summary of the amide resonances that partially disappear (grey-filled circles) or completely disappear (open circles) in the 1H–15N HSQC spectra of 15N-labeled P71T as a function of increasing NaCl concentration. Amide cross peaks whose intensity change little over the concentration range are indicated by solid circles and cross peaks that could not be tracked unambiguously are indicated by green-filled circles. The NaCl:P71T molar ratio are shown on the left. The full murine amelogenin sequence is shown with the proline residues colored cyan and the site of the P71 → T point mutation highlighted in red. Underneath the primary sequence is a schematic illustration of the three major regions of the protein: TRAP region (cyan); HQP-rich region (grey); and hydrophilic C-terminal region (magenta). (For interpretation of the references to colour in this figure legend, the reader is referred to the web version of this article.)

