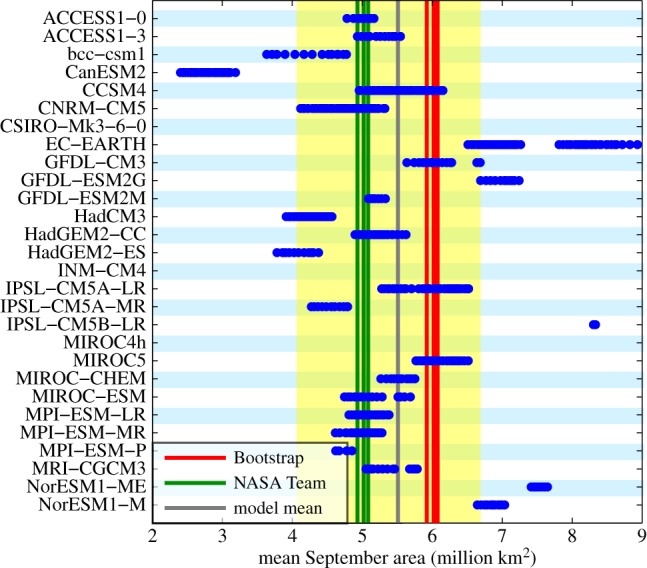
Figure 5.

Each dot represents for each simulation available in the CMIP5 archive the simulated mean in September Arctic sea-ice area for all 30-year-long periods starting between 1974 and 1984. The lines represent the respective values from satellite retrievals from 1979 onwards and for the multi-model mean across all simulations. The yellow area represents the range of mean area consistent with the external forcing as derived from those models that encompass the observed trend within their ensemble range.
