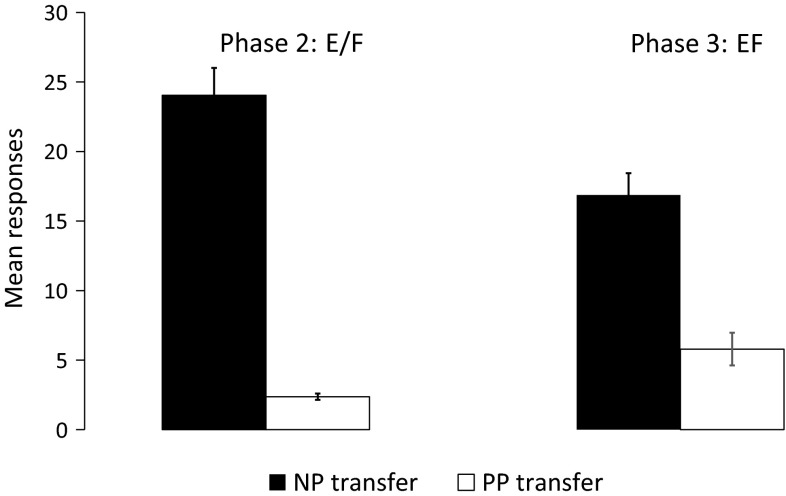
Fig. 5.
Mean number of responses during presentations of E and F during the last day of Phase 2 training (left) and mean number of responses during the first presentation of EF during Phase 3 training for NP transfer and PP transfer groups. Error bars represent between-subject standard error of the mean

