Fig. 4.
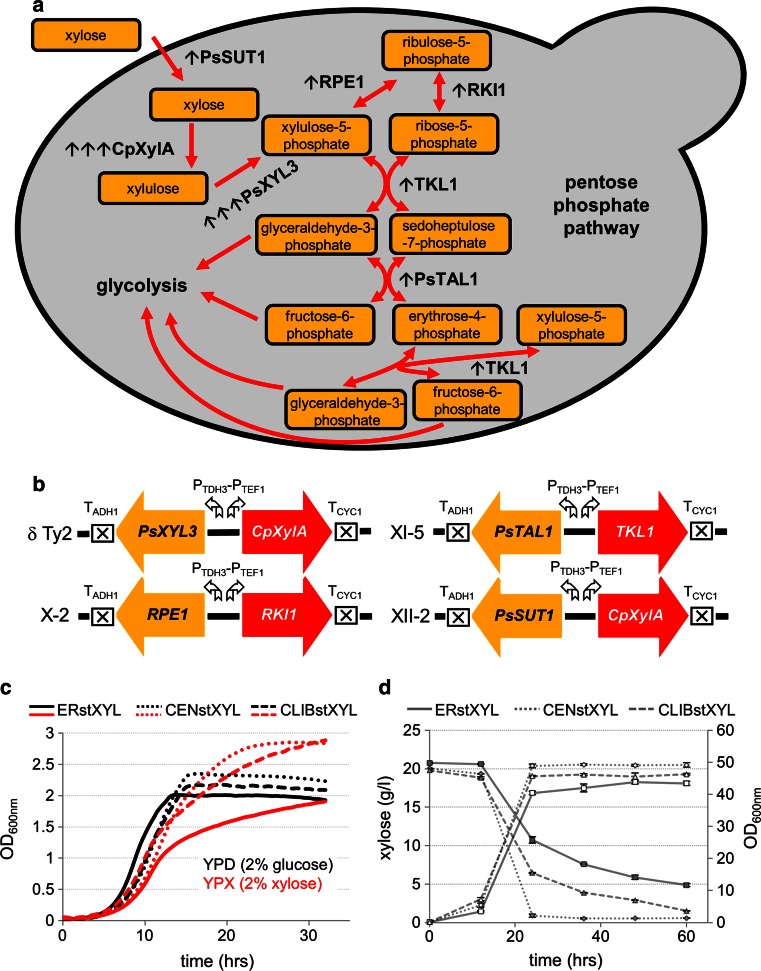
Engineering of industrial strains for xylose utilization. a Schematic illustration of the xylose isomerase pathway. The genes integrated using the EasyClone2.0 vectors are displayed. Single black arrows (↑) represent single integration, triple arrows (↑↑↑) represent multiple integration. b Schematic illustration of chromosomal insertions of the cloned xylose pathway genes in the genomes of CENstXYL, ERstXYL and CLIBstXYL strains. Particular chromosomal locations are displayed as well as promoters and terminators. c Growth curves of CENstXYL, ERstXYL and CLIBstXYL strains. The strains were grown in 100 μl of YPD (black curves) and YPX (red curves) media in microtiter plates, OD was determined with Biotek ELx808 microplate reader in 30 min intervals. The values were normalized to a 1 cm pathlength using pathlength correction performed according to manufacturer’s instructions. d The graph represents time course of xylose consumption by CENstXYL, ERstXYL and CLIBstXYL strains grown in 50 ml YPX medium in shake flasks. Samples were taken at regular time points and OD of the culture was determined with the NanoPhotometer Pearl (Implen, Germany) in a 1 cm pathlength cuvette, and xylose concentration was measured by HPLC. Xylose concentration is plotted on the primary y axis (closed symbols), OD values (open symbols) on the secondary y axis. The cultures were cultivated in triplicates. Error bars represent standard deviation (N = 3)

