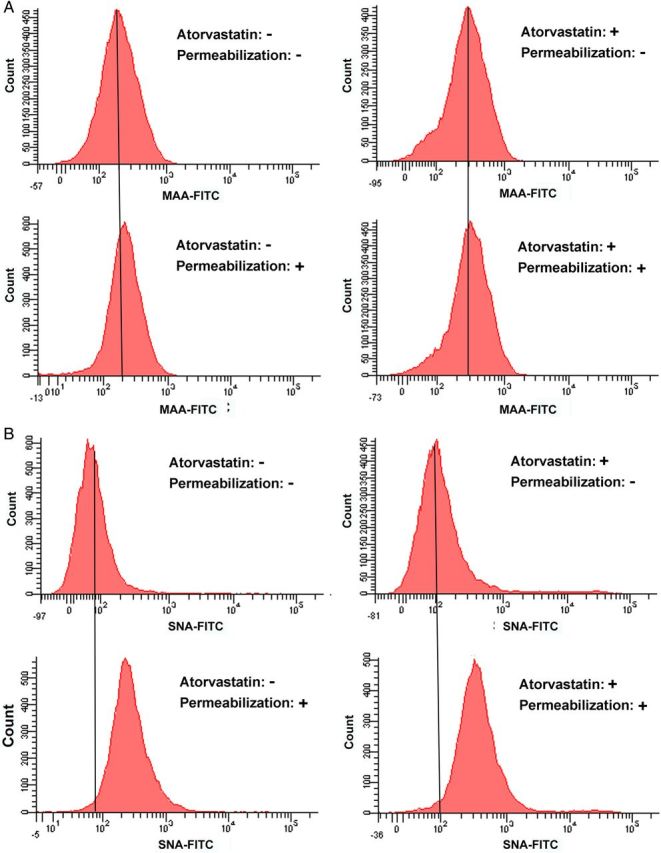
Fig. 3.

Comparison of the SA level after cell permeabilization. Atorvastatin+: Cells were treated with 20 μM atorvastatin for 24 h. Atorvastatin−: Cells were incubated with vehicle for 24 h. Permeabilization+: Cells were fixed with 4% PFA, followed by permeabilization with 0.2% Triton X-100 and then labeled with lectins. Permeabilization−: Cells were fixed with 4% PFA and then labeled with lectins. (A) Raw 264.7 cells at different conditions were labeled with MAA-FITC (10 μg/mL). (B) Raw 264.7 cells at different conditions were labeled with SNA-FITC (20 μg/mL). This figure is available in black and white in print and in colour at Glycobiology online.
