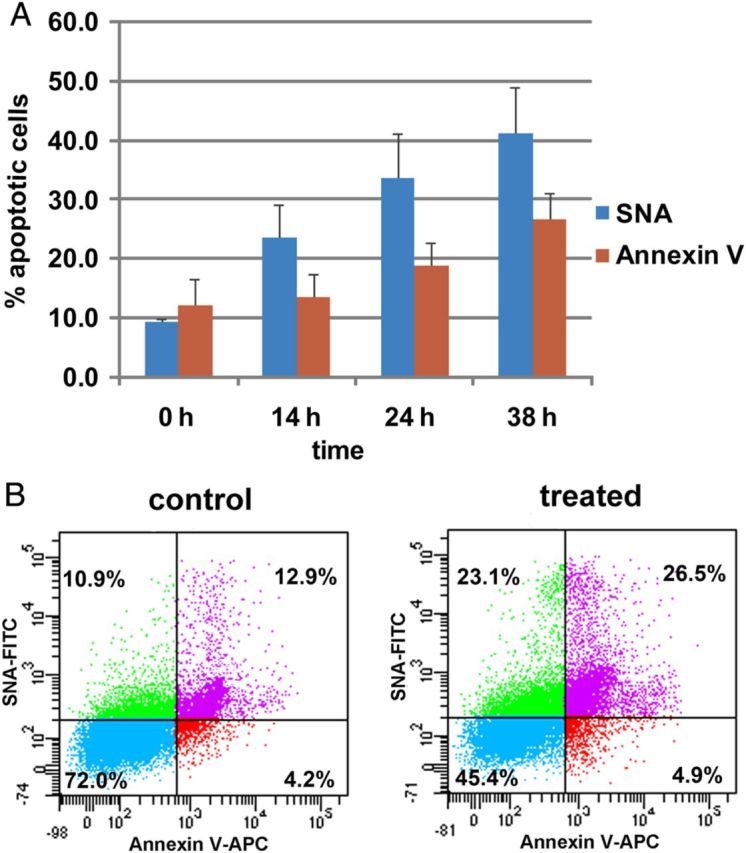
Fig. 4.

Comparison of SNA and Annexin V labeling of Raw 264.7 cells after cells incubated with atorvastatin. (A) Cells were treated with or without atorvastatin (20 μM) for 14, 24 and 38 h and then labeled with SNA or Annexin V. Both PI positive and negative cells are included here. Values represent the means and standard deviations from three independent experiments. (B) Cells were treated with atorvastatin (or vehicle) for 24 h, and then costained with SNA-FITC and Annexin V-APC. This figure is available in black and white in print and in colour at Glycobiology online.
