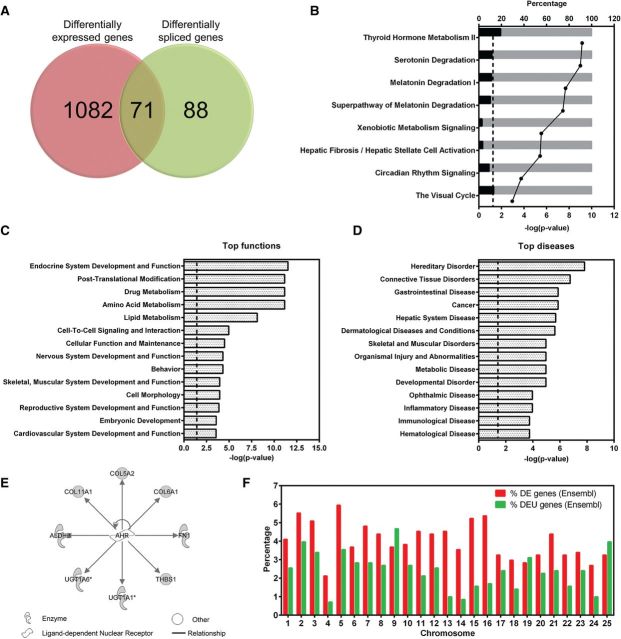
FIG. 9.
Overlap of DEU and differential expressed (DE) genes. Venn-diagrams show the overlap of genes affected by expression and/or splicing between BaP and control zebrafish larvae (96 hpf; A). IPA was used to identify the canonical pathways (B), top functions (C), and top disease pathways (D) that are affected by BaP at splicing and expression levels. In panel B, bars represent the percentage of overlaping genes (in black) within a pathway. Dots indicate the negative log10 of the P-values. Larger −log(P-value) means that the pathway is more significant. The threshold for significance is marked in the graph as a dotted-line at 1.3 (−log(0.05)). In panels C and D, bars represent −log(P-value), and dotted-lines indicate the significance threshold at 1.3 (−log(0.05)). Eight AHR-responsive genes were affected by splicing and expression with BaP treatment (E). Distribution of DE and DEU genes across zebrafish chromosomes is shown in (F). Full color version available online.

