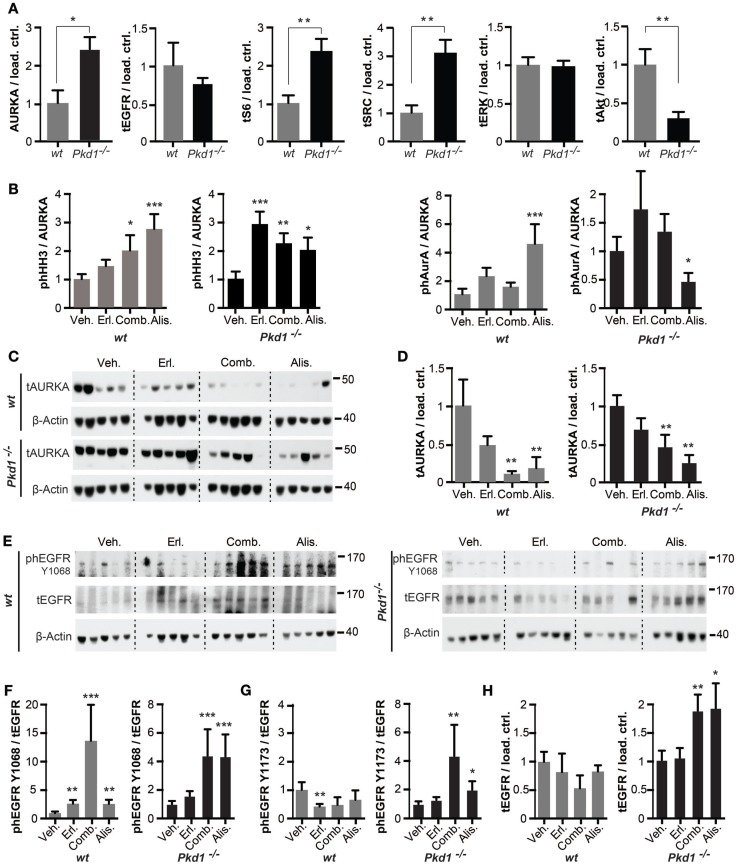
Figure 4.
Drug inhibition of targets in Pkd1−/− and wt mice. (A) Quantification of Western data for indicated proteins from kidney lysates prepared from vehicle-treated wt or Pkd1−/− mice, normalized to β-actin or vinculin-loading control. *P < 0.05 and **P < 0.01 relative to vehicle treated. (B) Aurora-A (AURKA) was immunoprecipitated from kidney lysates and used for in vitro kinase with γ-32P-ATP to indicate autophosphorylation and phosphorylation of histone H3 kinase (HH3) (top two rows), with parallel blots probed by Western to allow normalization to total AURKA and HH3 in reaction. Quantitation of data from complete cohort of mice in each treatment group, indicating ratio of phosphorylated HH3 or AURKA to total immunoprecipitated AURKA in wt and Pkd1−/− mice following indicated drug treatments. *P < 0.05, **P < 0.01, and ***P < 0.001 relative to vehicle treated. (C) Western analysis showing representative expression of total Aurora-A (tAURKA) in kidney lysates after 10 weeks of treatment with indicated drugs, with β-actin loading control. (D) Quantitation of data from complete cohort of mice in each treatment group, indicating ratio of total AURKA to β-actin in wt and Pkd1−/− mice following indicated drug treatments. **P < 0.01 relative to vehicle treated. (E) Western blot with representative images of kidney lysates from each treatment cohort showing expression of EGFRphosphorylated (ph) at the indicated amino acids, total EGFR (tEGFR) or β-actin loading control. (F–H) Quantitation of data from complete cohort of mice in each treatment group, indicating ratio of phEGFR-Y1068 to tEGFR (F), phEGFR-Y1173 to tEGFR (G), or tEGFR to loading control (H). *P < 0.05, **P < 0.01, and ***P < 0.001, relative to vehicle treated.

