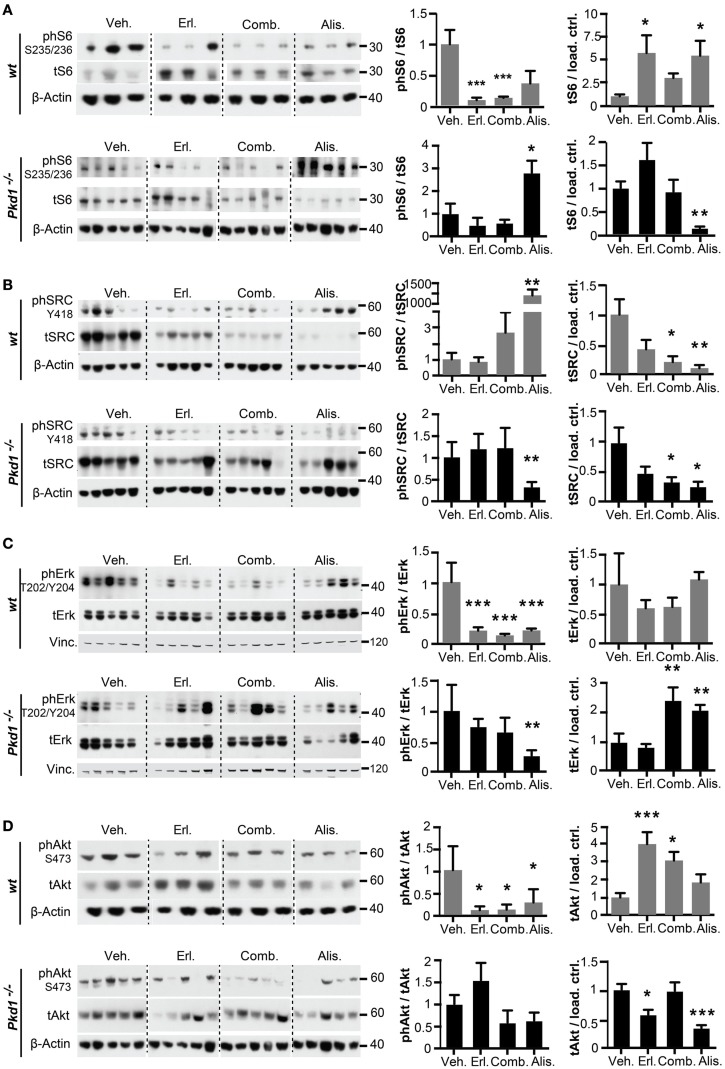
Figure 5.
Drug inhibition of ADPKD-related signaling proteins in Pkd1−/− and wt mice. S6 (A), SRC (B), ERK1/2 (C), and AKT (D) in kidney lysates after 10 weeks of treatment with indicated drugs. Western analysis (left) showing representative expression of phosphorylated and total expression of proteins and quantitation of data (right) from complete cohort of mice in each treatment group with analysis, as described in Figure 4. (A–D) Ratios of phosphorylated to total protein for S6 (A), SRC (B), ERK1/2 (C), and AKT (D) are shown in the left graph, and ratios of total protein to β-actin or vinculin (vinc) loading control are shown in the right graph. *P < 0.05, **P < 0.01, and ***P < 0.001 relative to vehicle treated.

