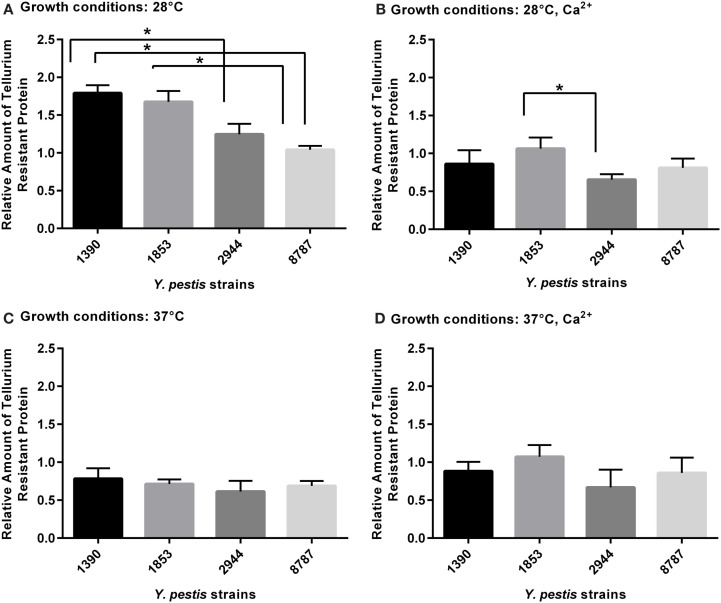
Figure 5.
Relative amount of tellurium-resistance protein expressed by Y. pestis strains 1390, 1853, 2944, and 8787 at physiological growth conditions (A) 28°C; (B) 28°C, Ca2+; (C) 37°C; and (D) 37°C, Ca2+. The relative amount of protein expressed was calculated from immunostained bands, by dividing the optical density of the band by the optical density of the corresponding 30 μg total protein standard. Data represent the mean + SEM. *Indicates significant differences (p < 0.05).

