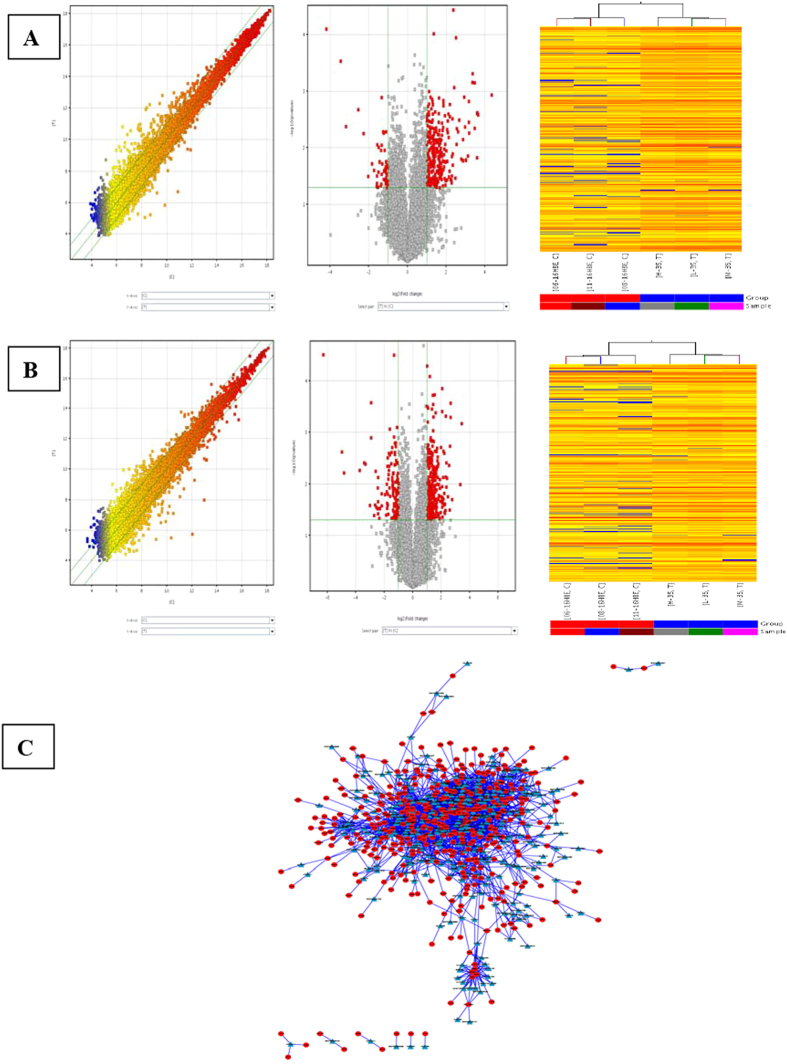
Figure 1. LncRNA and mRNA expression profiles and co-expression network in Cd-induced 35th cells (T) as compared to untreated 16HBE cells (C).
Hierarchical clustering was performed to show the distinguishable lncRNAs and mRNAs expression patterns in Cd-induced 35th cells (T) as compared to untreated 16HBE cells. (A) Differentially expressed lncRNAs and (B) differentially expressed mRNAs were detected. The A and B left panels showed the scatter-plot for T vs C. The A and B middle panels showed the volcano plot which was constructed using 2.0-fold up and down change values and p-values of 0.05. Red point in the plot represented the differentially expressed lncRNAs and mRNAs with statistical significance. The A and B right panels showed Hierarchical clustering for differentially expressed lncRNAs and mRNAs in T vs C. “Red” indicated high relative expression, and “blue” indicated low relative expression. (C) CNC network was constructed based on the correlation analysis between differentially expressed lncRNAs and mRNAs in Cd-induced 35th 16HBE cells as compared to untreated 16HBE cells. Triangle: lncRNA; circle: mRNA.

