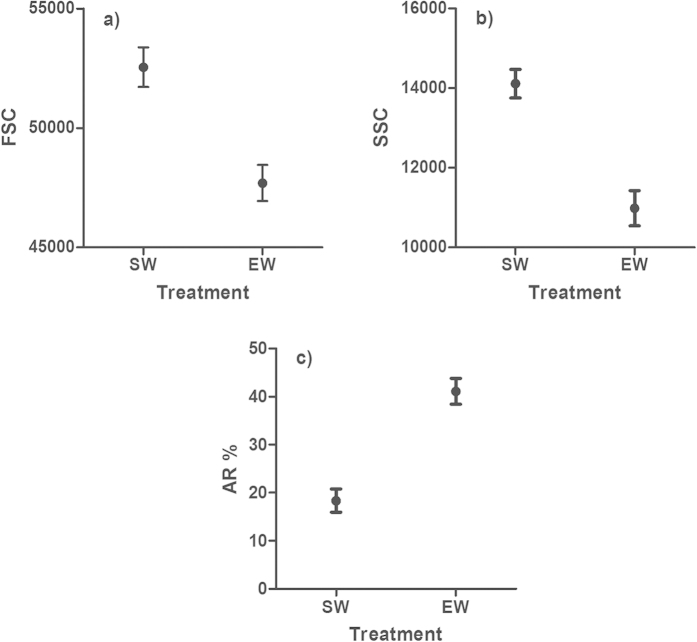
Figure 2. Measured flow cytometer variables for sperm acrosome reaction.
Dots represent mean (±s.e.) values of forward scatter (FSC) area (a), side scatter (SSC) area (b) and the proportion of sperm in the sub-population (see Fig. 1) “acrosome-reacted sperm” (c) in sea water (SW) and egg water (EW) treatments. N = 31 in all cases.

