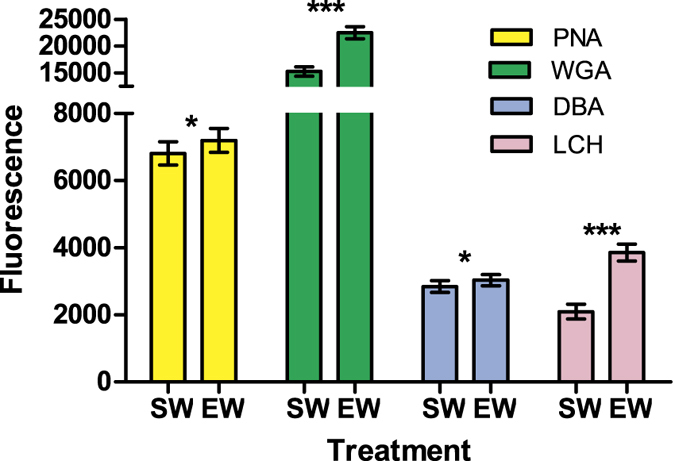
Figure 4. Sperm lectin binding measured by flow cytometer.

Bars represent mean (±s.e.) fluorescence intensity of four lectins (PNA, WGA, DBA and LCH) in sperm samples treated with sea water (“SW”) or fresh egg water (“EW”). Asterisks indicate statistically significant differences between treatments (*P < 0.05; ***P < 0.001). Note differential scaling of the top and bottom segments of y-axis.
