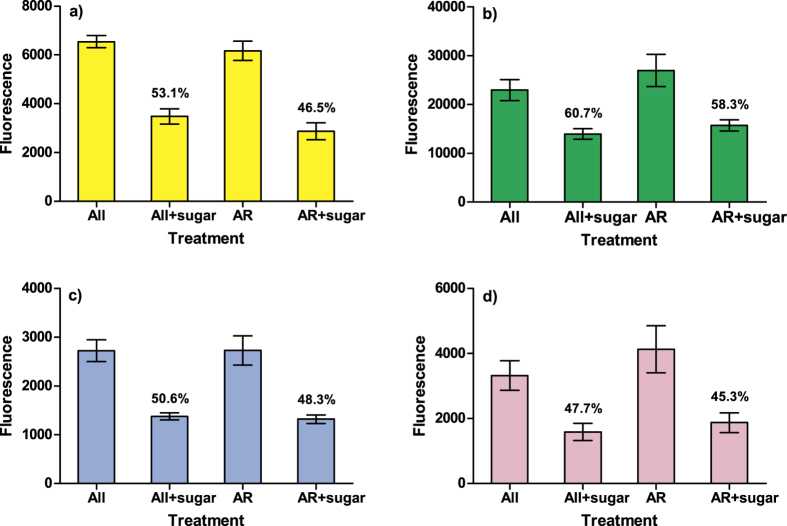
Figure 6. Specificity of lectin binding.
Bars represent mean (±s.e.) fluorescence of PNA (a), WGA (b), DBA (c) and LCH (d) in total (“All”) sperm and acrosome-reacted sperm population (“AR”) labeled with 10 μg/ml of lectins with or without pre-treatment of inhibiting sugars. Percentages indicate the relative proportion of fluorescence intensity of sugar-treated samples in relation sperm without pre-treatment.

