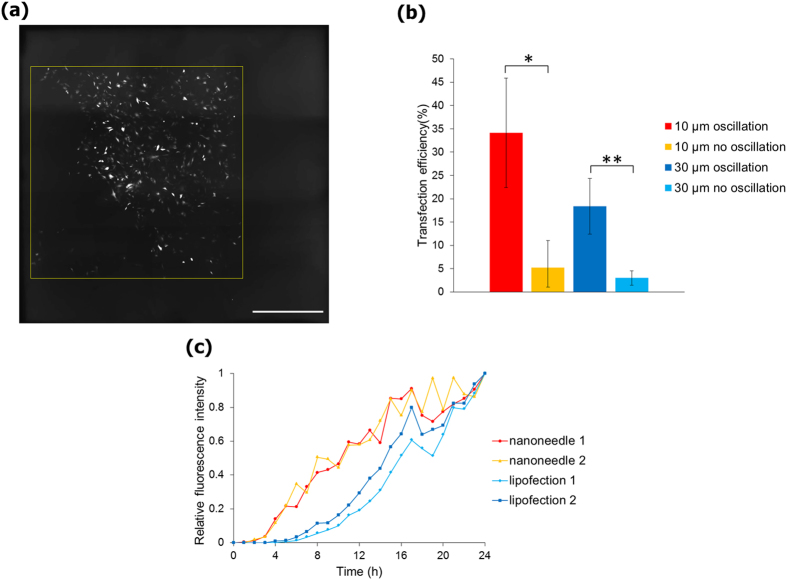
Figure 4. Delivery of plasmid DNA with the use of the nanoneedle array.
(a) Fluorescent images of NIH3T3 cells transfected with pCS2-Venus plasmids using a 10 μm-pitch nanoneedle array. Yellow square of 3 × 3 mm represents the contact area covered with the nanoneedle array. (b) Transfection efficiencies using the nanoneedle array with and without oscillation. n = 3 for each condition. Two-sided Student’s t-test was performed. *P = 0.036, **P = 0.024. Error bars are SD. (c) Time course of relative fluorescence intensity after introduction of pCS2-Venus. Cells transfected with plasmid DNAs were observed by fluorescence microscopy and fluorescence intensities were analyzed from images with use of ImageJ. Fluorescence intensity after 24 h is indicated as 1. Scale bar in (a) is 10 μm.

