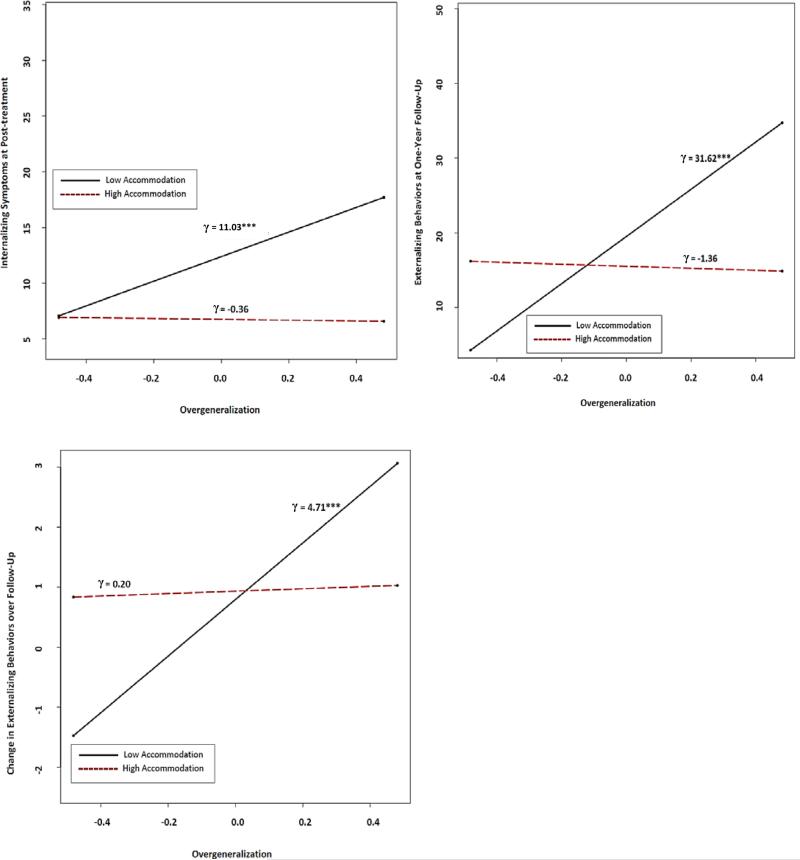
Figure 2.
Simple slopes showing the conditional association between overgeneralization (x-axis) and outcome (y-axis) at high (1 SD above the mean) and low (1 SD below the mean) levels of accommodation Overgeneralization and accommodation are grand-centered so that a score of zero represents the average level of each variable across all 81 youth. γ = unstandardized coefficient representing the simple slope of children with high and low levels of accommodation. *** p ≤ .001.

