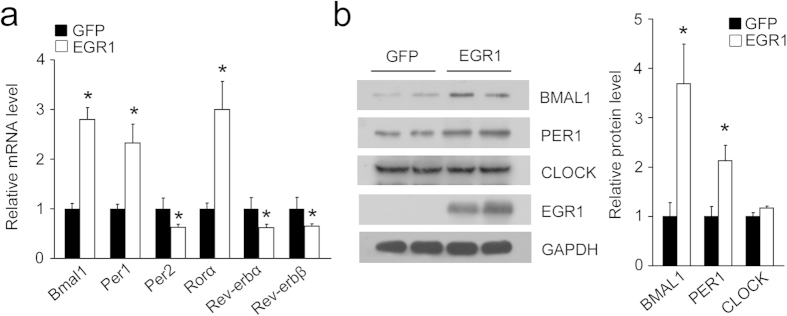
Figure 3. Regulation of clock genes by EGR1.

(a) qPCR analysis of clock genes in primary hepatocytes infected with GFP or EGR1 adenoviruses for 48 h. *P < 0.04. (b) Immunoblots of cell lysates of primary hepatocytes using the indicated antibodies. The gels were run under the same experimental conditions. The full-length blots are presented in Supplementary Fig. 7. Data are shown as the mean ± s.d. *P < 0.05.
