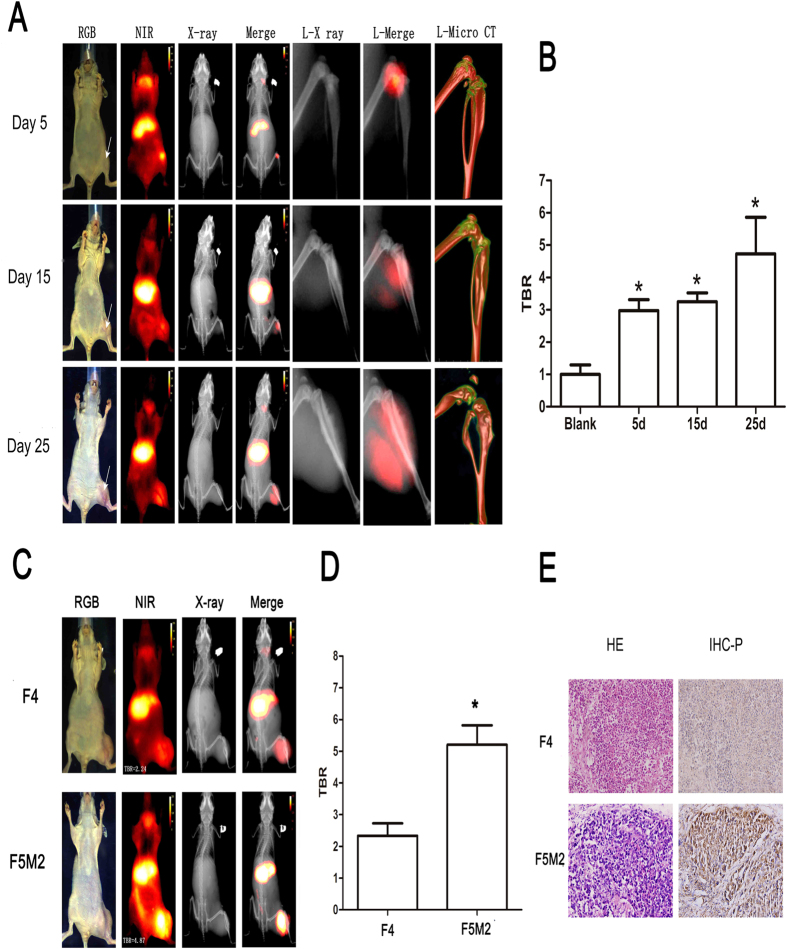
Figure 2. Mouse human osteosarcoma xenografts show preferential uptake and retention of CXCR4-IR-783.
(A) Imaging studies were carried out 72 hours after injection of CXCR4-IR-783 at 5, 15 and 25 days post inoculation of F5M2 cells. The arrow in the leftmost RGB images indicates tumor location. Temporal changes of tumor sites are shown in the RGB images, the NIR images (red) of the whole body (NIR) or the tumor bearing leg (L-NIR), the X-ray images of the whole body (X-ray) or the tumor bearing leg (L-X ray) as well as CT skeleton images of the tumor bearing leg (L-Micro-CT). Merge or L-merge images of the NIR and X-ray images of the whole body or the tumor-bearing legs are shown by minimizing the extra-tumor signal of NIR. (B) The tumor-to-background ratios (TBR) at the tumor site in three separate time points show time-dependent increase of CXCR4-IR-783 uptake and retention by the tumor xenograft. N = 10, *p < 0.05 versus the blank control. (C) Comparison of NIR images of mice bearing F4 or F5M2 osteosarcoma xenografts 72 hours post injection of CXCR4-IR-783 at Day 25 post inoculation of the tumor cells. F4: mouse bearing F4 osteosarcoma xenograft; F5M2: mouse bearing F5M2 osteosarcoma xenograft. (D) The tumor-to-background ratios at the tumor site of mice bearing F4 and F5M2 osteosarcoma xenografts. *p < 0.05 versus F4. (E) H&E staining (left panel) and immunohistochemistry for CXCR4 (right panel) of the corresponding tumor tissue or normal tissues. Representative images are shown in (A,C) and compared at the same intensity scale.

