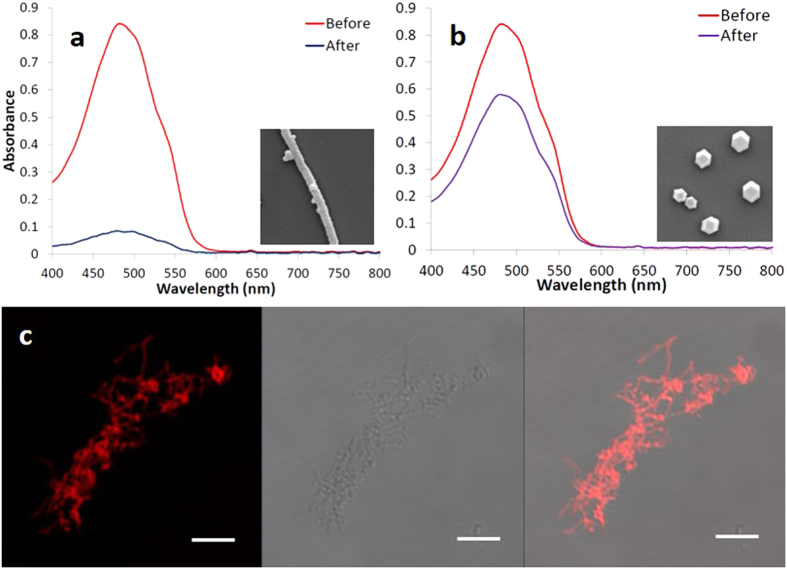
Figure 3. UV-Vis absorption spectra of DOX solutions before and after interactions with (a) hollow filamentous ZIF-8 NTs and (b) compact ZIF-8 NPs.
The insets are the SEM images of the ZIF-8 NTs and NPs, respectively; (c) shows the LSCM images of filamentous ZIF-8 NTs loaded with DOX. The image on the left is the fluorescence image; the image in the middle is the transmission image; the image on the right is the overlay of these two images. The scale bars correspond to 5 μm.

