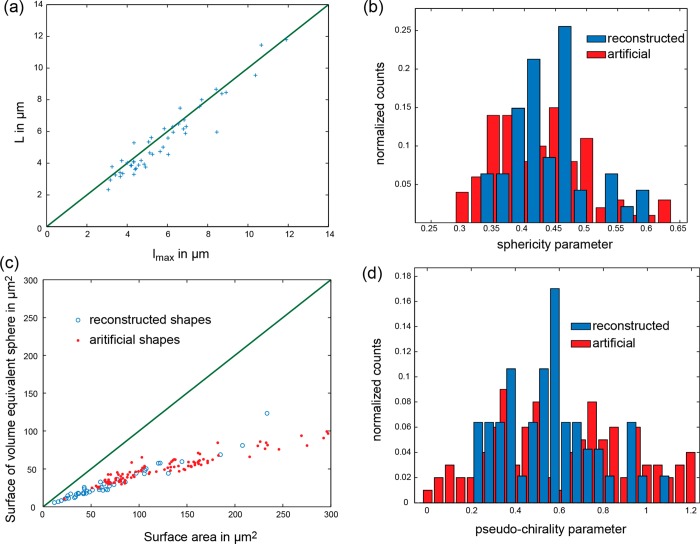
Figure 2.
(a) Plot of the microstructure size measured in video frames (L) against the maximum voxel to voxel distance in the reconstructed shapes (lmax). The reconstructed shape consists of 3D voxels, thus lmax is a measure of the microstructure size. The green line is a line through the origin with slope one. The good correspondence between the two measures of propeller size is an indication of the quality of the 3D reconstruction. (b) Normalized histograms of the geometric parameter sphericity extracted from reconstructed (blue) as well as artificially generated (red) shapes. (c) The surface area of spheres, equivalent in volume to the reconstructed (blue) or artificially generated (red) shapes, is plotted against the measured surface area of the shapes. This plot is used to characterize the compactness of shapes and again indicates the similarity of reconstructed and generated shapes. (d) Same as (b) but for pseudochirality instead of sphericity.

