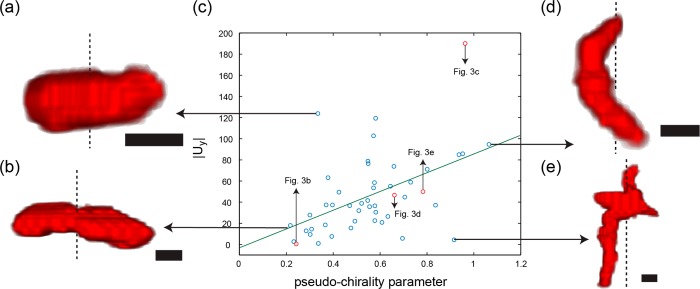
Figure 5.
Correlation between the dimensionless speed and the pseudochirality. The absolute value of the dimensionless speed is plotted against the pseudochirality in panel (blue and red circles) (c). The data points corresponding to propellers displayed in Figure 3 are marked in red. The green line is a linear fit to the data. (a) This structure has a high dimensionless speed, despite having a relatively low pseudochirality. This might be because some small but important geometric features could not be resolved in optical microscopy. (b) This structure has a low pseudochirality and also a low dimensionless speed. (d) This structure has a high pseudochirality and also a high dimensionless-speed. (e) This relatively large structure has a very low dimensionless speed, despite having a high pseudochirality. The rotation axes of the propellers are marked by dashed lines, scale bars are 1 μm.

