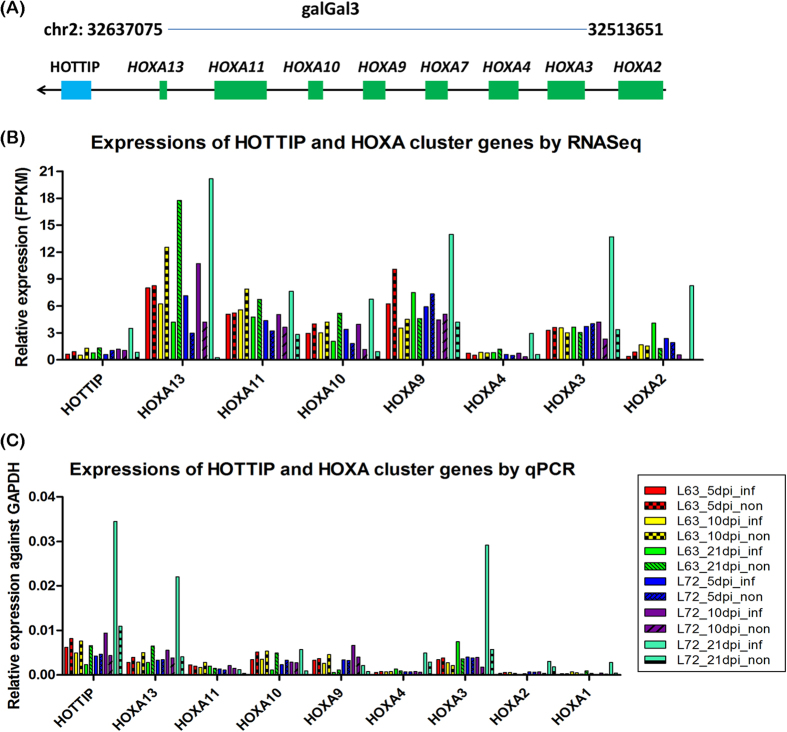
Figure 6. The expressions of HOTTIP homolog and HOXA cluster genes across all chickens with different conditions for two chicken lines.
(A) The schematic diagram of HOTTIP and HOXA cluster genes on chicken genome (galGal3). (B) Expressions of HOTTIP and HOXA cluster genes were determined by RNA sequencing and the result showed that HOTTIP homolog in chicken was positively correlated with HOXA genes in the cluster for the same individual. Besides, with the increased distance to HOTTIP (from HOXA13 to HOXA2), expressions of HOXA genes would gradually decrease.

