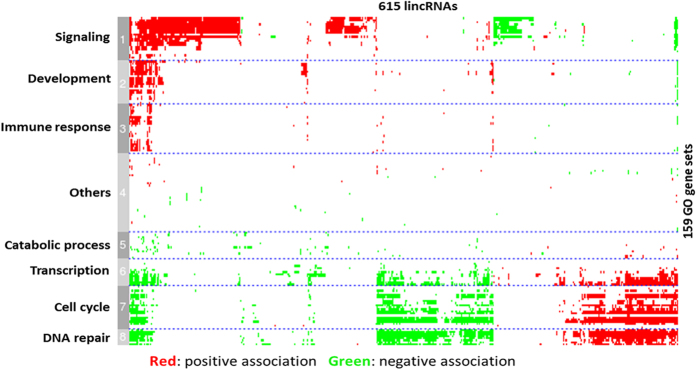
Figure 8. Computational lincRNA function annotation.

Expression-based association matrix of 615 lincRNA loci (column) and 159 functional genes sets (row). Red represents positive association, green represents negative association, and white represents no significant association. Based on GO gene sets, the matrix was classified into 8 clusters and GO function for each cluster is labeled on the left.
