
Figure 9. LincRNA expression signatures.
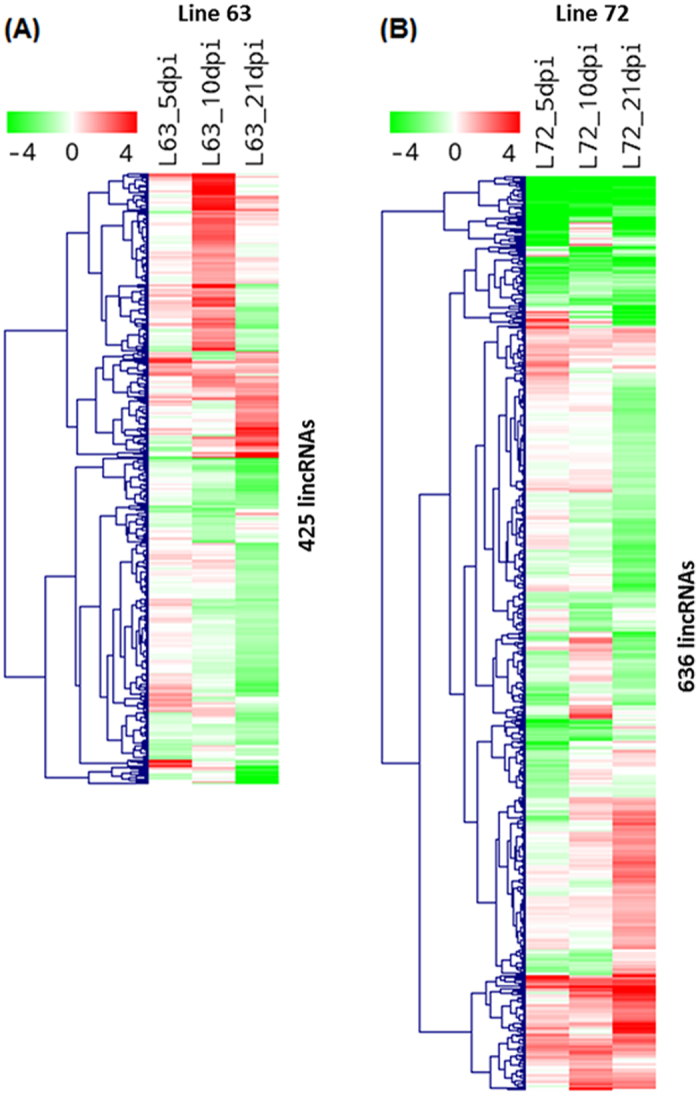
Expression profiles of differential expressed lincRNAs between infected and non-infected chickens at three time-points of each line. LincRNAs were indicated as rows and different experimental conditions were indicated as columns. Each value represents log2 ratio of a lincRNA expression level in infected chicken compared to non-infected chicken. The matrix was clustered by lincRNAs using hieratical clustering with complete linkage. Red indicates up-regulation and green represents down-regulation. (A) Expression profile for 425 differentially expressed lincRNAs in line 63. (B) Expression profile for 636 differentially expressed lincRNAs in line 72.