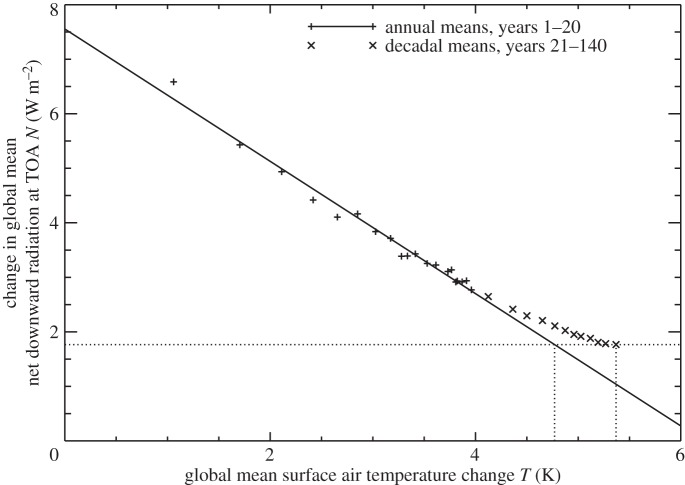
Figure 5.
Relationship between annual means of the change in global mean net downward radiative flux N at the top of the atmosphere and the change in surface air temperature T in the ensemble mean of CMIP5 abrupt4xCO2 experiments. The solid line is a linear regression of N against T for years 1–20. The dotted lines indicate the time-mean N and T for years 131–140 and the estimate of T from the linear regression.

