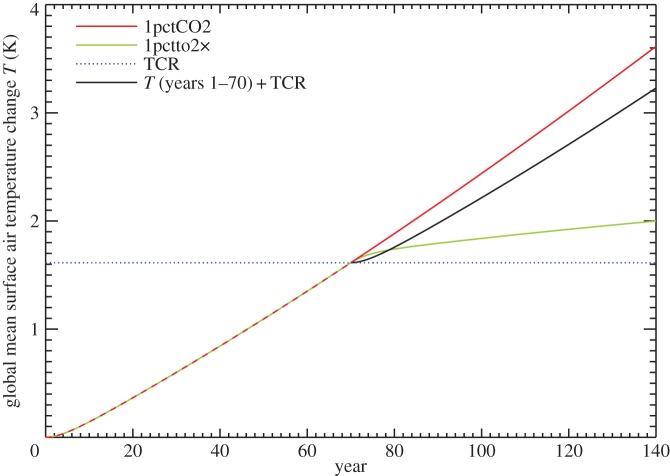
Figure 9.
Comparison of global mean surface air temperature change T under the 1pctCO2 and 1pctto2x scenarios in the two-layer model fitted to the NorESM1-M AOGCM. The two scenarios are the same for years 1–70. The black line is T in years 1–70 translated rightward by 70 years and upward by the TCR, i.e. T at year 70.

