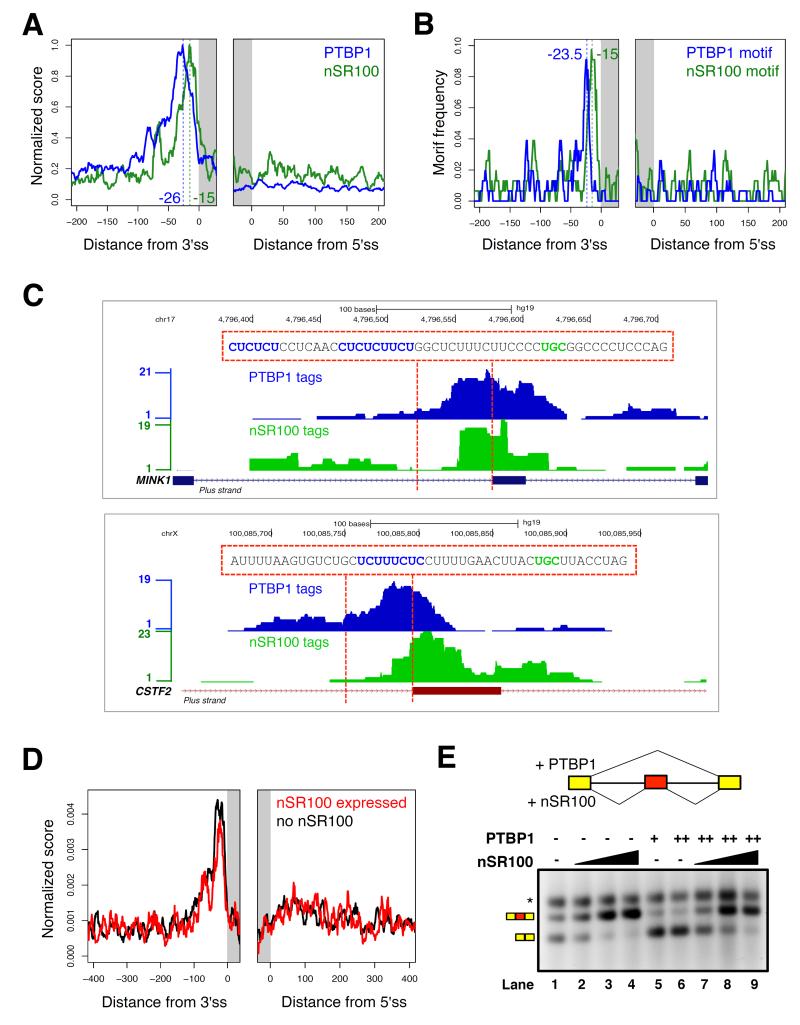
Figure 6. nSR100 directly overcomes PTBP1-mediated repression to promote exon inclusion.
(A) Merged RNA binding map showing the mean, normalized density of PTBP1 (blue) and nSR100 (green) crosslinked sites in 200 nucleotide windows encompassing conserved nSR100-regulated exons in 293T cells; ss, splice site.
(B) Distribution of PTBP1 and nSR100 binding motifs in 200 nucleotide windows surrounding conserved nSR100 target exons in human.
(C) Representative genome browser tracks showing the raw density of PTBP1 (blue) and nSR100 (green) PAR-iCLIP tags flanking the MINK1 (top) and CSTF2 (bottom) target exons. Genomic sequences between the dotted lines are displayed with binding sites for PTBP1 (blue) and nSR100 (green) highlighted.
(D) RNA binding maps of the mean, normalized density of PTBP1 crosslinked sites surrounding conserved nSR100-regulated exons in control uninduced (black) and dox-induced nSR100-expressing (red) 293T cells.
(E) In vitro splicing assay monitoring AS of the Daam1 neural exon in the presence and absence of purified nSR100 and/or PTBP1 proteins in Weri-Rb1 splicing extracts. The splicing reporter consists of constitutively spliced 5′ and 3′ MINX exons and the Daam1 neural exon flanked by its native intron sequences. Amount of proteins used: Lane 1: no protein; lanes 2, 3 and 4: 50, 100 and 200 ng nSR100, respectively; lanes 5 and 6: 100 and 200 ng PTBP1, respectively; lanes 7, 8 and 9: 200 ng PTBP1 and 50, 100 or 200 ng nSR100, respectively. Asterisk, non-specific band. See also Figure S6.

