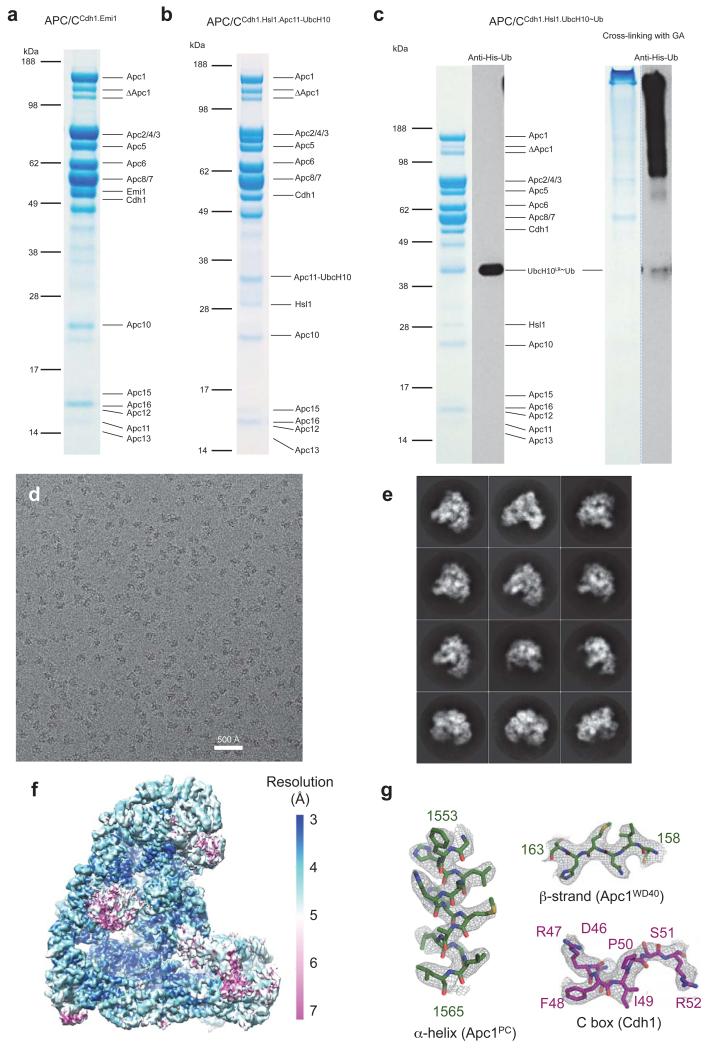
Extended Data Figure 1. Preparations and EM images of APC/C complexes.
(a) Coomassie blue stained SDS gel of APC/CCdh1.Emi1. (b) Coomassie blue stained SDS gel of APC/CCdh1.Hsl1.Apc11-UbcH10. (c) Coomassie blue stained SDS gel and Western blot analysis (anti-His antibody - only ubiquitin in the complex contains His tag) of APC/CCdh1.Hsl1.UbcH10-Ub without or with cross-linking by glutaraldehyde (GA). (d) A typical cryo-EM micrograph of APC/CCdh1.Emi1. Representative of 3328 micrographs. (e) Gallery of 2D averages of APC/CCdh1.Emi1 showing different views. Representative of 100 2D averages. (f) Local resolution map of APC/CCdh1.Emi1 showing resolution range. (g) Details of EM density for segments of α-helix and β-strand of Apc1 and the C box of Cdh1.

