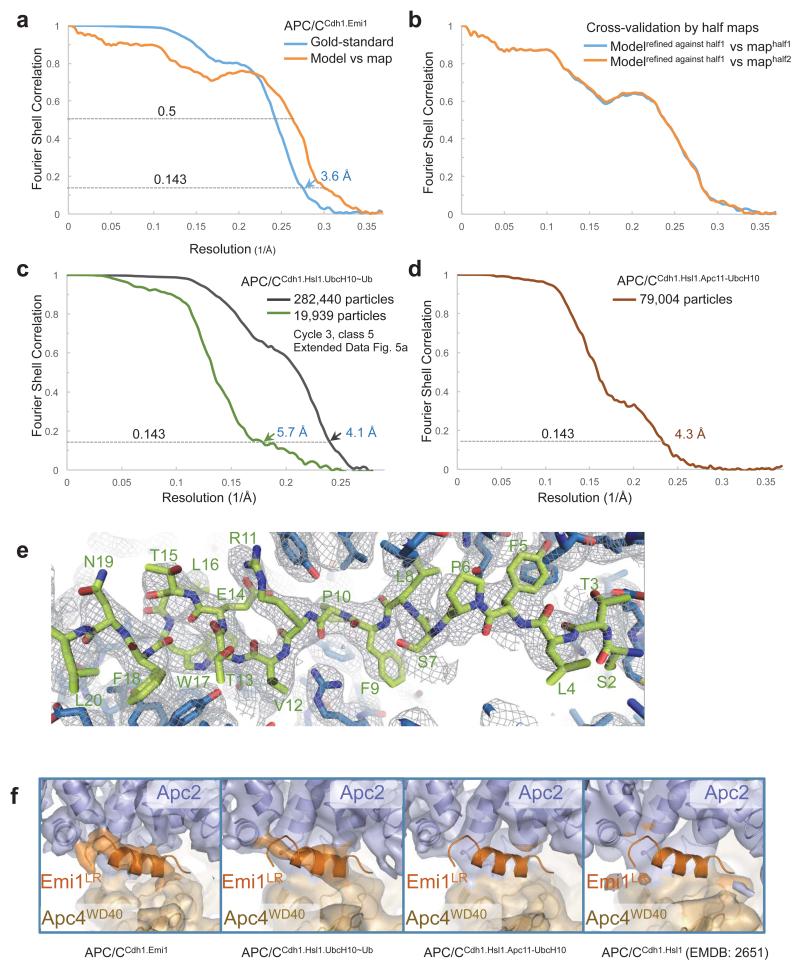
Extended Data Figure 2. Resolution estimation and example of de novo model building.
(a) Gold standard Fourier Shell Correlation (FSC) curve and FSC curve between cryo-EM map and final atomic model of the APC/CCdh1.Emi1. (b) Cross-validation of model refinement by half maps. Shown are FSC curves between the atomic model and the half map (maphalf1) it was refined against and FSC curve between the atomic model and the other half map (maphalf2) that was not used during refinement. (c) Gold standard FSC curve of APC/CCdh1.Hsl1.UbcH10-Ub. (d) Gold standard FSC curves of human APC/CCdh1.Hsl1.Apc11-UbcH10. (e) de novo model building of Apc15 N-terminal loop. The surrounding Apc5 residues are also shown. (f) EM density for the LR tail common to Emi1 and Ube2S is only observed in APC/C complexes with subunits incorporating the LR tail. (i) APC/CCdh1.Emi1. (ii) An APC/C complex with an LR tail-bearing subunit (UbcH10LR of APC/CCdh1.Hsl1.UbcH10-Ub). (iii) No LR tail density in APC/CCdh1.Hsl1.Apc11-UbcH10 fusion and (iv) APC/CCdh1.Hsl1 (Ref. 4).

