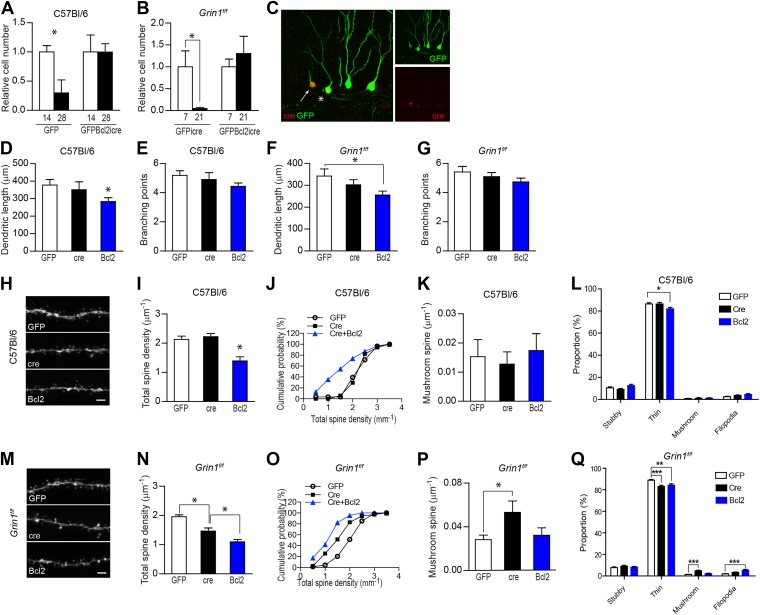
Figure 3. NR1 KO cells rescued by expression of the pro-survival gene Bcl2 had an unusually low spine density.
(A) Bcl2 expression was able to rescue newborn GCs from naturally occurring cell death in C57Bl/6 mice. (B) Bcl2 expression was able to rescue NR1 KO newborn GCs from cell death. (C) For morphological analysis of GFPBcl2-ires-cre-targeted cells, rv GFPBcl2-ires-cre was co-injected with rv GFP. Bcl2-ires-cre-targeted cells were identified by immunohistochemistry using an antibody against the cre recombinase. The arrow and asterisk show GCs transfected by both rv GFPBcl2-ires-cre and rv GFP. Insets on the right side represent GFP− (green) and Cre-expressing (red) GCs, respectively. (D–G) Analysis of dendritic growth of newborn GCs at 28 dpi. Bcl2-rescued newborn GCs had a decreased total dendritic length in both C57Bl/6 and Grin1f/f mice (D, F), whereas branching points were not changed (E, G). (H) Representative images of dendritic processes in the outer molecular layer of newborn GCs at 28 dpi in C57Bl/6 mice labeled by rv GFP, GFP-ires-cre and GFPBcl2-ires-cre. (I, J) Total spine density was similar in GFP and GFP-ires-cre targeted newborn GCs but significantly decreased in GFPBcl2-ires-cre targeted newborn GCs. (K) The density of mushroom spines did not change significantly in newborn GCs targeted by the three retroviruses. (L) Comparison of the percentage of each spine type relative to total spine numbers in new GCs of C57Bl/6 mice infected by the three retroviruses. (M) Representative images of dendritic processes in the outer molecular layer of newborn GCs at 28 dpi in Grin1f/f mice labeled by rv GFP, GFP-ires-cre and GFPBcl2-ires-cre. (N, O) Total spine density was significantly lower in surviving NR1 KO cells (Cre) and further decreased in Bcl2-rescued cells. (P) Mushroom spine density was increased in NR1 KO cells (Cre) but not in Bcl2-rescued cells. (Q) Comparison of the percentage of each spine type relative to total spine numbers in new GCs of Grin1f/f mice infected by the three retroviruses. Scale bars: 20 µm (C) and 2 µm (H, M).


