
Figure 1.
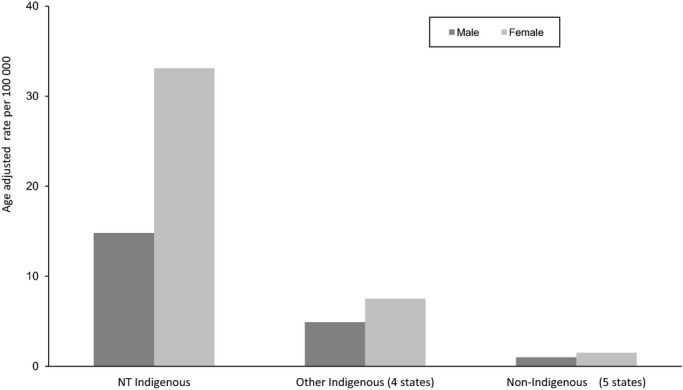
Age-adjusted mortality rate in the period 1997–2005 for Indigenous persons in the NT compared with Indigenous persons in the 4 states and non-Indigenous persons in the 5 states (male and female). 4 states indicates New South Wales, Queensland, South Australia, and Western Australia; 5 states, New South Wales, Queensland, South Australia, Western Australia, and the Northern Territory; NT, Northern Territory.