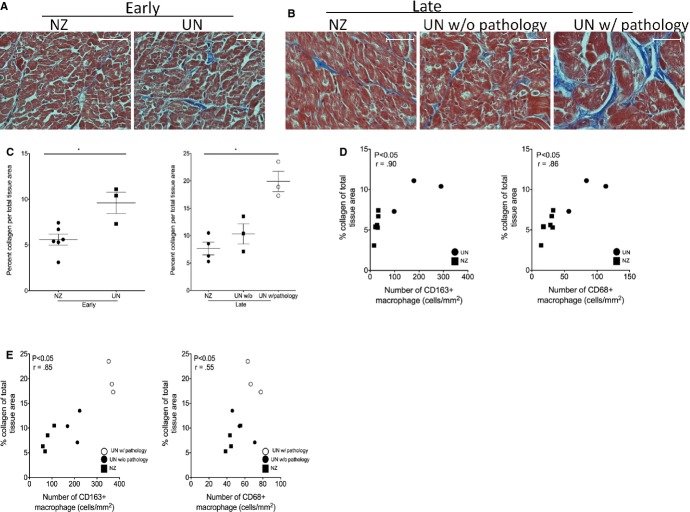
Figure 2.
Natalizumab treatment decreases fibrosis in the left ventricle of SIV-infected, CD8-lymphocyte-depleted rhesus macaques. A and B, Modified Masson’s trichrome stain was used to compare the percent collage per total tissue area, a marker of fibrosis, in the left ventricle of early and late natalizumab-treated animals compared to untreated controls. C, Natalizumab treatment resulted in decreased fibrosis in cardiac tissues, compared to controls, regardless of when treatment began. In animals that began natalizumab treatment at 0 days postinfection (dpi), there was a significant decrease in the amount of collagen per tissue area (5.58±2.56%), compared to untreated controls (9.6±2.06%; nonparametric Mann–Whitney t test, P<0.05). Animals that began natalizumab treated at 28 dpi also showed a significant decrease in the amount of collagen per total tissue area (8.66±2.31%), when compared to untreated controls with cardiac pathology (19.91±1.85%). There was no difference in the percent collagen per total tissue area in late natalizumab-treated animals, compared to untreated controls without cardiac pathology. Spearman rank test was used to determine whether there was a correlation between decreases in fibrosis in natalizumab-treated animals and numbers of macrophages. D, In early natalizumab-treated animals (closed square), there was a correlation between the decrease in numbers of CD163+ and CD68+ macrophages and decreases in fibrosis, when compared to untreated controls (closed circle). E, In late natalizumab-treated animals (closed square), there was a correlation between decreases in CD163+ and CD68+ macrophages, compared to untreated controls with (open circle) and untreated controls without pathology (closed circle). r=spearman coefficient, P<0.05. Statistical analysis between early natalizumab-treated animals and controls was done using a nonparametric Mann–Whitney t test. For late natalizumab-treated animals and untreated controls with and without cardiac pathology, an ANOVA was performed first, and, if significant, a post-hoc nonparametric Mann–Whitney t test was performed (*P<0.05). Scale bar=50 μm, ×400 magnification. Error bars represent the average number of positive cells/mm2±SEM. NZ indicates natalizumab treated; UN, untreated.

