
Figure 8.
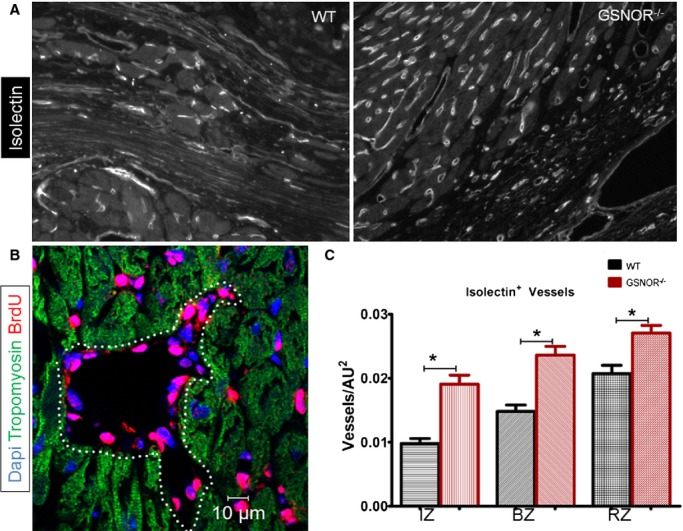
Enhanced neovascularization in post MI GSNOR−⁄− hearts. A, Representative immunofluorescent images of isolectin-IB4 in WT (left panel) and GSNOR−⁄− (right panel) hearts, 2 months post MI. B, BrdU incorporation in coronary vascular cells of a GSNOR−⁄− heart, demonstrates the presence of newly regenerated coronary vessels 1 month post MI. C, Quantification of isolectin-IB4+ vessels demonstrates that GSNOR−⁄− mice are characterized by a significantly enhanced vascular density compared with WT (1-way ANOVA, *P<0.0001). Values are mean±SEM. ANOVA indicates analysis of variance; BrdU, 5-bromodeoxyuridine; BZ, border zone; GSNOR, S-nitrosoglutathione reductase; IZ, infarct zone; MI, myocardial infarction; RZ, remote zone; WT, wild-type.