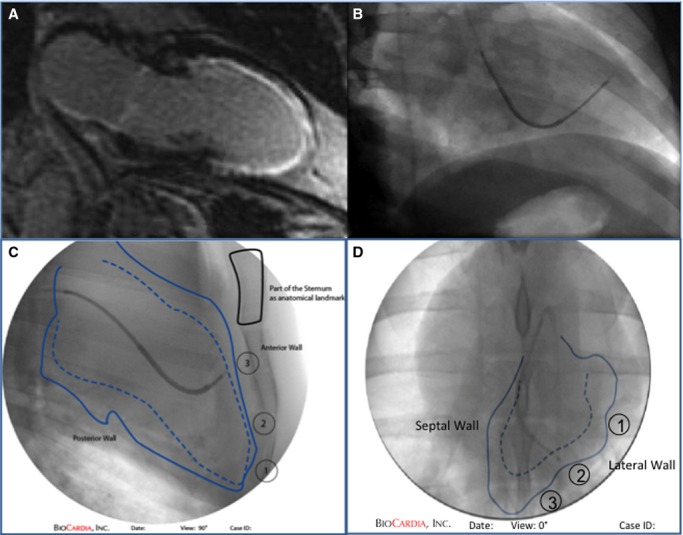
Figure 2.

Fluoroscopically guided catheter cell delivery. Cell and control injections are targeted to the mid- to apical segments in each quadrant using (A) delayed gadolinium enhancement reference to the infarct zone and (B) biplane fluoroscopic mapping. Manual tracings documenting the locations of the injections are shown from (C and D) 2 different fluoroscopic projections. The sternum is used as an anatomical landmark, and the locations of injection are tracked numerically as marked.19
