
Figure 3.
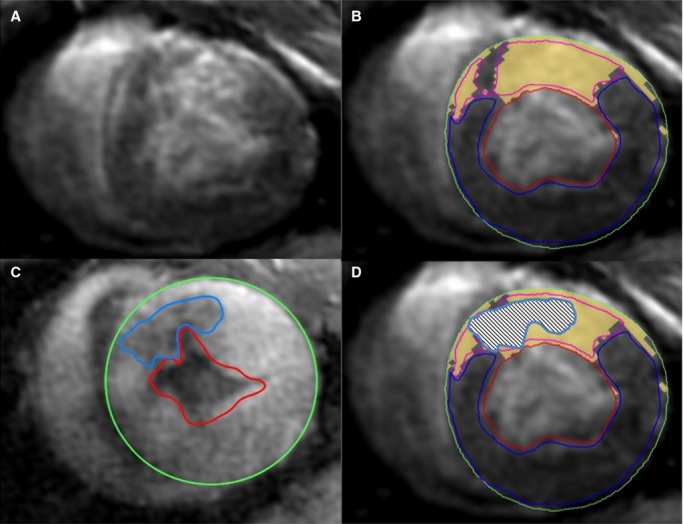
Regions of interest for DEMRI and MEMRI. Representative (A and B) short-axis DEMRI and (C) MEMRI images showing semiautomatic tracing of ROIs in a pig heart 6 weeks after human amniotic mesenchymal stem cell delivery. The signal threshold standard deviation method was used for DEMRI and MEMRI quantification with manual correction. Note the overall smaller MEMRI-defect area (blue ROI) compared with the yellow DEMRI-positive region. (D) Superimposed DEMRI and MEMRI infarct ROIs show the extent of PIR on either edge of the positive DEMRI regions still labeled yellow. DEMRI indicates delayed gadolinium enhancement magnetic resonance imaging; MEMRI, manganese-enhanced magnetic resonance imaging; PIR, peri-infarct region; ROI, region of interest.