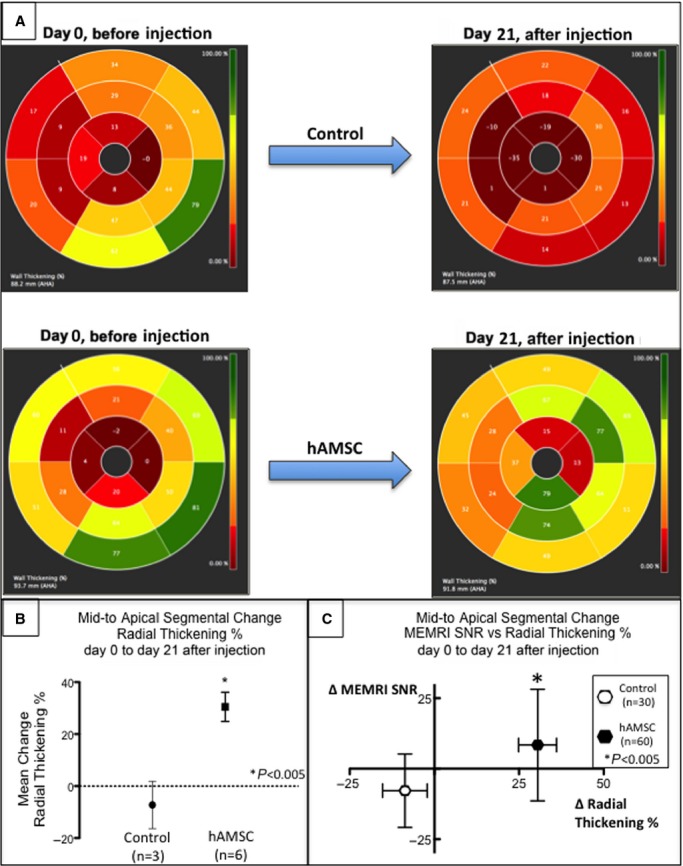
Figure 9.

Segmental improvement in hAMSC-treated hearts by percentages of both MEMRI and radial thickening. A, Polar maps depicting representative percentages of radial thickening at days 0 to 21 after injection from the mid- to apical segments (segments 7 to 16 of American Heart Association 16-segment model) of the control and hAMSC-treated hearts. Note the significant improvement (brighter color map in mid- to apical segments) in the hAMSC-treated heart compared with control (darker color map in day 21 mid- to apical segments). B, Percentage of mid- to apical segmental radial strain measurements in control vs hAMSC-treated hearts. Note the significant increase in mean percentage of segmental radial strain in hAMSC hearts. C, Scatterplot of change in segmental MEMRI signal (y-axis) vs change in percentage of radial thickening (x-axis) from both control (open symbols) and hAMSC-treated (closed symbols) hearts. Note the distribution of hAMSC-treated hearts in the upper right quadrant, reflecting an association of improved MEMRI signal of myocardial viability and improved radial thickening. Conversely, the control hearts exhibited worsened MEMRI signal and lower percentage of radial thickening, consistent with the lack of functional recovery in the control hearts. hAMSC indicates human amniotic mesenchymal stem cell; MEMRI, manganese-enhanced magnetic resonance imaging; SNR, signal/noise ratio.
