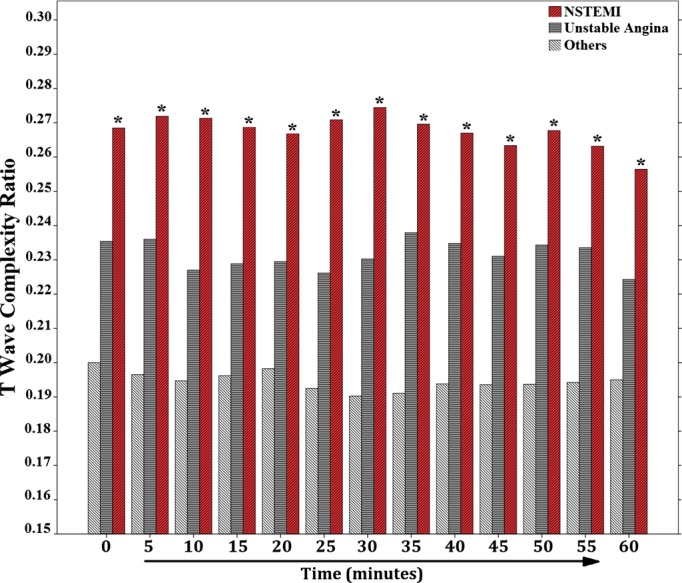
Figure 2.

Magnitude of ventricular repolarization dispersion between groups. This figure shows the mean repolarization complexity between groups. Time zero represents the baseline 12-lead ECG, and other time points represent the 5-minute averages. *Significant against “others” subcategory during each time point using repeated-measures ANOVA with Tukey’s post-hoc adjustment. In any single group, there were no differences in T-wave complexity across different time points. ECG indicates electrocardiogram; NSTEMI, non-ST elevation myocardial infarction.
