
Figure 2.
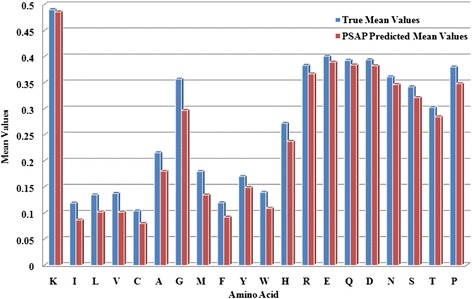
True mean values and PSAP predicted mean values for 20 types of amino acid on PSAP2312 datasets. The blue bar represents the true mean values, while the red bar represents the PSO-SVR predicted values.
Official websites use .gov
A
.gov website belongs to an official
government organization in the United States.
Secure .gov websites use HTTPS
A lock (
) or https:// means you've safely
connected to the .gov website. Share sensitive
information only on official, secure websites.
True mean values and PSAP predicted mean values for 20 types of amino acid on PSAP2312 datasets. The blue bar represents the true mean values, while the red bar represents the PSO-SVR predicted values.